Heavy Rain Event of May 14-16th, 2001
Current Weather · Forecast Products
|
Training Thunderstorms and the Heavy Rain Event of May 14-16, 2001
Jeff Andresen, Steve Aichele, and Aaron Pollyea, Geography
Between Monday afternoon the 14th and Wednesday afternoon the 16th, heavy rain fell over large areas of Lower Michigan. Some of the 24- and 48-hour totals were record-breaking, with 2-day totals in excess of 6 inches at a few locations. The heavy rain caused extensive flooding and crop damage in some areas. Meteorologically, the event was the result of a series of training thunderstorms that formed along and just east of a warm front which Monday afternoon stretched from the western Upper Peninsula southeastward through the southwestern corner of Lower Michigan. So-called 'training thunderstorms' are named after their appearance on radar in which individual storms develop and move across the same area. This repeated movement over the same area often results in torrential rainfalls and flash flooding. In the Midwest region, this mechanism is responsible for the majority of record heavy rainfall events. 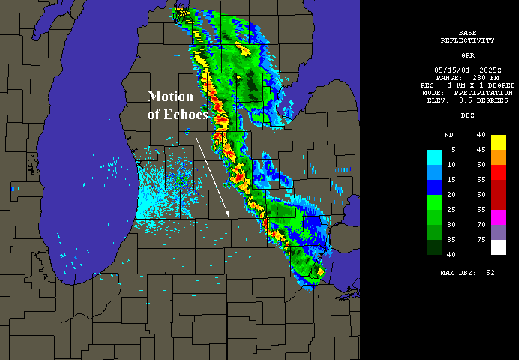
Figure 1. Radar reflectivities and relative echo directional movement at 4:25 PM May 15th. Brightest echoes (red and orange areas in color) correspond to heaviest precipitation rates (Figure courtesy of Intellicast, Inc.). Monday afternoon the 14th, surface air temperatures varied as much as 30F across the Lower Peninsula, ranging from the upper 80's in extreme southwestern corner to the upper 50's only 200 miles away to the northeast. Dewpoint temperatures, a measure of water vapor (the 'raw material' for precipitation) rose to the low to mid 60's F in southwestern Lower Michigan in association with strong southerly winds and the northward transport of large amounts of Gulf of Mexico-origin moisture. With strong low-level (less than 5,000 above sea level) convergence of winds along the front and the resulting lifting, thunderstorms formed in a northwest to southwest line along the area of greatest temperature discontinuity. There were three major episodes of thunderstorms; the first late Monday evening into Tuesday morning, Tuesday afternoon and evening, and finally early Wednesday morning. The unique banding character of thunderstorm formation is evident in the radar depiction of the second thunderstorm episode Tuesday afternoon in Figure 1. Because of northwesterly middle and upper level winds, the movement of the individual thunderstorms was towards the southeast almost directly along the line of convective formation, which resulted in the training pattern. Estimated accumulated precipitation totals during the 48 hour period from Monday evening through Wednesday evening are given in Figure 2. These estimates are based on 2.5-mile spatial resolution National Weather Service NEXRAD Stage III radar reflectivities. While not actual precipitation measurements, the estimates are calibrated with available rain gage data and quality-controlled for known contamination problems such as hail (which did occur in the Monday evening/Tuesday morning event) and should at least be 'in the ballpark' with actual totals. Overall, the estimates still offer an analysis at a spatial resolution not obtainable with conventional rain gage data. In Figure 2, the spatial patterns of precipitation resulting from the training thunderstorm episodes are clearly evident. The colored/shaded areas depict all areas with greater than 1 inch of total precipitation. Chronologically, the first thunderstorm episode brought heavy rain along a line roughly from Oceana County southeastward to Hillsdale County. The second episode (illustrated in Figure 1) occurred along a narrow line from Osceola County southeastward to Monroe County. Early Wednesday morning, a third episode caused heavy rainfall totals in a more widespread area from the central Upper Peninsula southeastward through northwestern Lower Michigan to the Indiana/Ohio/Michigan border area. Overall, large sections of northwestern, west central, and south central Lower Michigan received more than 3 inches. The heaviest rainfall total in this period occurred across southern sections of Oceana County and along the Gratiot/Isabella County line, where more than 9 inches were estiamted. In stark contrast, rainfall totals across sections of extreme southwestern and eastern Lower Michigan were in many cases less than 0.25 inches. Climatologically, greatest 10-year 48-hour precipitation totals (an event that would be expected to occur only once every 10 years on the average) range from about 4.0 inches in southwestern Lower Michigan to less than 3.5 inches in northeastern sections of the state. The 100-year 48-hour event event ranges from 7.0 inches in southwestern sections of the state to less than 5.0 inches in the northeast. Thus, at least in sections of west central and central Lower Michigan, this event should be considered very rare by historical standards. Finally, in the 'for what it's worth' category, we offer another perspective of this precipitation event. One of the magic tricks included in a Geographic Information System software package such as that used to create Figure 2 is the ability to spatially sum up all of the precipitation that fell in this period, which in this case is the total volume of rain water that fell within the political boundaries of the state of Michigan during the given 48-hour period. Not including what fell over any of the surrounding Great Lakes, this number turns out to be 264 billion cubic feet of water. If spread out evenly across all of the land area in the state of Michigan, this would amount to a rainfall event of just under 2 inches statewide. Lastly, given all the current national publicity concerning the lack of energy, let's also remember that 64,000 BTUs of energy were used to evaporate each cubic foot of water (mostly over the Gulf of Mexico and land between Michigan and the Gulf Region) and released once again when the water vapor condensed into clouds and precipitation. This energy was originally provided directly and indirectly from the sun. For this volume of precipitation, and given a total nationwide energy consumption for the entire year in 1999of 9.7 x 10¹⁶ BTUs (E.P.A., 2000), that translates to an estimated energy release (during the series of precipitation events) equivalent to 64 days of total nationwide energy consumption. 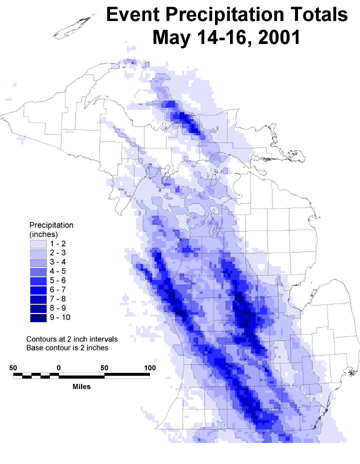
Figure 2. Total estimated precipitation (inches) from 08:00 PM Monday May 14th through 08:00PM Wednesday May 16th. Raw data courtesy of the National Weather Service North Central Regional River Forecast Center, Chanhassen, MN. |