2001 Growing Season Weather Summary
Current Weather · Forecast Products
|
2001 Growing Season Weather Summary Jeff Andresen Michigan State University Weatherwise, the 2001 growing season was characterized by extremes of water availability, initially as too much and later in the season, by too little. Drought and moisture stress plagued crops in much of the Great Lakes region to some extent, especially during the months of July and August. The drought conditions were very ill-timed in an agricultural sense because they coincided with stages of greatest water needs for many crops. From late April through early June, much of the region experienced persistent heavy rain and ironically, some flooding (e.g. more than 10 inches of rain fell in the Grand Rapids, MI area during May alone, a new record total for the month). The early wetness in these areas delayed planting of summer crops and resulted in shallower than normal rooting systems for crops already established. A major change in the configuration of the jet steam across North America in mid-June led to a much drier weather pattern which persisted from late June through mid-August. This pattern is well-illustrated in the daily time series of observed vs. normal precipitation accumulation and daily precipitation totals at Lansing from late May through late August in Figure 1. Given normal monthly precipitation totals in the state ranging from 2.8-3.6 inches, the rainfall deficit at Lansing by mid-August was likely at least 3 inches. In Michigan, dryness and moisture stress conditions were most intense in northern and eastern sections, with less than 25% of normal precipitation totals in many sections of the northern and eastern Lower Peninsula during July and early August, including some of the Thumb and Saginaw Valley regions, where no rain fell from late June through early August. NOAA's Palmer drought index, which characterizes long term, hydrological surpluses and deficits, categorized conditions in this area during much of late July and August as 'moderate to severe drought'. In many of the worst impacted areas, precipitation deficits of 3-6 inches or more were common by mid-August. In a meteorological sense, the drought was associated with a large, persistent upper air ridge across the Upper Midwest and warm, dry air aloft, which effectively inhibited convection across the state (this is the reason a series of rainfall-bearing weather disturbances moving into the Michigan from the west rapidly dissipated as they moved into the state, with only sprinkles or light rainfall totals). The abnormal dryness in Michigan was part of a regional pattern, stretching from Michigan eastward through southern Ontario, sections of Ohio, Pennsylvania, New York and into New England., and more recently, into crop production areas of the central Corn Belt region. In terms of timing, the drought impacted many summer crops during moisture-sensitive growth stages and/or stages of greatest water need (including silk/pollination for corn), leading to moisture stress which peaked in the first half of August. Reported crop damage was highly variable from area to area, with some spots benefitting from very timely rains and/or from soil profiles with greater stored water availability. Plant available moisture from the top 6 feet of the soil profile at field capacity typically ranges from 3-8 inches for soils in the region. A return to an upper air ridging pattern across the Midwest during late September and much of October brought warmer, drier weather, which when combined with a later than normal first killing freeze of the fall allowed many crops slowed by earlier cool temperatures to reach maturity. Overall, for the 5-month May-September period, mean temperatures and growing degree day accumulations ranged from near to below normal statewide. Precipitation was highly variable, ranging from below normal totals in northern sections of the state to much above normal levels in the south. Topsoil Moisture Content During Wet and Dry Periods The 2001 growing season will go down in the records as one of extremes in terms of soil moisture variability. Following unusually wet and cool conditions early in the growing season (including all-time records for May precipitation totals at some locations), dry conditions developed during the latter half of June and continued through much of July. Climatologically, soil moisture content is a result of the balance of water inputs, largely precipitation, and losses, including evapotranspiration (the combined loss of water through plant transpiration and soil evaporation), runoff, and drainage into groundwater. For most (unirrigated) soils in the Great Lakes region, this balance is dominated by precipitation and evapotranspiration. On an annual basis, soil water content tends to reach a maximum level during the early spring (prior to warm temperatures and vegetative growth), gradually decreasing during the summer to a minimum level in the fall, followed by the over winter recharge period in which losses to evapotranspiration are low due to low temperatures and minimal vegetative growth. Among the variables monitored at stations in the Michigan Automated Weather Network (MAWN) is volumetric soil moisture, which is expressed as the ratio of water to soil in the same volume. This is a soil-specific characteristic dependent of the textural make-up of the soil and the size and shapes of its pore spaces. It thus can vary widely from site to site, but typically ranges from about 0.10 to 0.35 in.water3/in.soil 3 (or just in3/in3 for short). Volumetric soil moisture is estimated at MAWN stations by a 12-inch forked probe which measures the dielectric constant of the volume of soil surrounding the probe which in turn is strongly dependent on the amount of water content. The probes were installed vertically into grass-covered soil next to the station, thus estimating average soil moisture content in the top 12 inches of the profile. Mean daily soil moisture contents in the top 12 inches of the soil profile and daily precipitation totals at the Albion, MI MAWN station from the 1st of April through the 16th of July are displayed in Figure 2. The moisture content during this period briefly exceeded 0.30 in3/in3 following 4.0+ inches of rainfall over a 3-day period from the 14th-16th of May and fell to only 0.15 in3/in3 by the 16th of July. The rapid rises and slower, logarithmic decreases of soil moisture are strongly associated with the frequency and magnitude of daily precipitation. A rule of thumb that can be used when considering moisture in a soil profile down to rooting depth is that the total amount of plant available water in the profile decreases by 10% of the amount left on the previous day (given no added rainfall or irrigation). Thus, there is a gradual reduction of the daily total water loss over time. This decreasing reduction produces a pattern similar to that observed in Figure 2. There are two major decreases in the study period: between late April and early May (a drop from 0.30 in3/in3 to 0.17 in 3/in3), and between mid June and the end of the series (July 16th), when the soil moisture drops from almost 0.28 in3/in3 to about 0.15 in3/in3. Like many atmospheric variables and processes, there are more than one temporal cycle present over long periods of time. Volumetric soil moisture content is no exception. Besides an annual cycle associated with the changing seasons, a distinct diurnal cycle is also frequently present, as can be seen in the three-day series of hourly average volumetric moisture content values at the same site (Albion) for the 26th-28th of June, 2001 (Figure 3). During each of these three days, the water content steadily drops during the daylight hours followed by a partial recovery during evening hours. The daytime losses are due to evapotranspiration while the recovery is associated with capillary movement of water upwards from lower layers and with the presence of dew on the ground surface (the sensor monitors all water within an elliptical-shaped radius pattern around the probe forks). Weather conditions on these three days were very similar in terms of air and soil temperature, relative humidity, and wind speed. In humid climates such as those usually experienced in Michigan, the rate of evapotranspiration is strongly dependent on the levels of incident solar radiation (wind speed and relative humidity play relatively larger roles in more arid climates). From data at the Albion MAWN station daily solar radiation totals of 518, 567, and 640 langleys/day were recorded for the 26th-28th, which are positively correlated with the approximate daytime water losses from this layer of 0.15, 0.20, and 0.25 in3/in3 respectively. So what does all this mean in terms of water management? In order to make some sense of these values of volumetric soil moisture, we must also consider the physical characteristics of the soil as well as plant canopy characteristics (which determine the rate of evapotranspiration losses). The canopy above the soil profile was kept mowed to an approximately 4-inch height. For the sake of simplicity, we shall conveniently assume that the roots of this grass are all located within the top 12 inches layer being monitored (likely not too far from reality). A soil survey of Calhoun County identifies the soil series in the vicinity of the station as Kalamazoo Loam, which has relatively similar fractions of sand, clay, and silt (USDA/NRCS, 1997). Plant-available water in the top 12 inches of the profile was measured in a number of representative Kalamazoo soil profiles by NRCS, resulting in a mean field capacity (roughly the maximum amount of water the soil can hold at equilibrium with gravity) of approximately 0.28 in3/in3 and a wilting point (the moisture level at which permanent plant wilt occurs) of 0.08 in3/in3, which is a typical representative range of soil moisture contents for this soil series and not too dissimilar from the range of values taken from the sensor at Albion (Figure 2). For the first of the two figures, the total water in the top 12 inches at the maximum moisture content of 0.30 in3/in3 on April 19th totals 3.6 inches (12 in.soil * 0.30 in.water 3/in.soil). Note that this value is above the level of field capacity from the NRCS lab data and, given the magnitude, probably is close to the soil's saturation point in which all of the pores in the soil are filled with water. By the 11th of May, the average daily value fell to 0.18 in 3/in3 for a total decrease of 2.16 inches. Thus, the loss of water in the 12 inch layer over this relatively dry 21-day period is 3.6 inches - 2.16 inches = 1.44 inches, or an average of 0.07 inches per day. For the reasons mentioned above, this value is only an average and not representative of many of the days earlier in the drying period, when daily rates were greater. This is evident in Figure 3, where soil moisture levels were closer to the upper end of the range and daily decreases of 0.015, 0.020, and 0.025 in3/in3 were partially offset by additions of 0.005 in3/in3 for net 12-inch layer decreases of 0.12, 0.18, and 0.24 inches, respectively. Given no addition of any other water during this 3-day period (no runoff) and assuming minimal drainage losses , these values can then be thought of as good estimates of actual evapotranspiration from the canopy when it was relatively well-watered. At the end of the daily series in Figure 2, moisture levels off near 0.15 in3/in3 (just above the wilting point given by the NRCS lab data), likely because available water for the grass canopy has become very limited and the plants have partially shut down or become semi-dormant, in turn reducing the amount of water lost to the atmosphere in evapotranspiration. In summary, the volumetric soil moisture probes offer some ability to monitor soil moisture content with more precision and at a lower cost than previous types of sensors. As with any technology, however, there are some potential drawbacks. First, the probes only take the top 12 inches of the soil profile into account. Many field crops grown in Michigan have deep rooting systems (e.g alfalfa, corn) potentially reaching down to a 6 foot depth or greater. In addition, soil moisture can vary widely over space, even within the same field. This is especially true in Michigan, where soil types vary from beach sand to heavy clay to organic muck. Thus, the numbers from the MAWN stations should serve as a general guide for topsoil layers only, with careful consideration of soil type. Figure 1. Daily precipitation totals and observed vs. normal precipitation accumulations at Lansing, MI from late May through late August, 2001 (image courtesy of NOAA Climate Prediction Center). 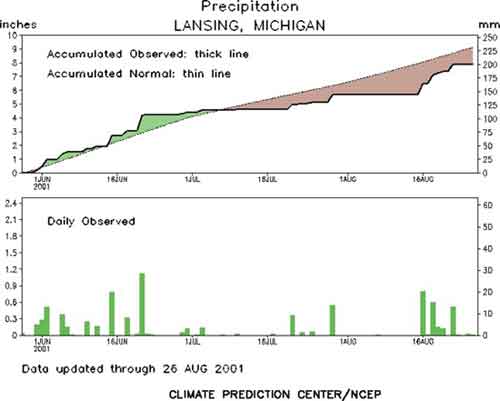
Figure 2. Daily mean volumetric soil moisture (in3/in3) in the top 12 inches of the soil profile (under a 4-inch canopy) and precipitation (inches) from the MAWN automated weather station in Albion, MI, 1 April 2001 through 16 July, 2001. 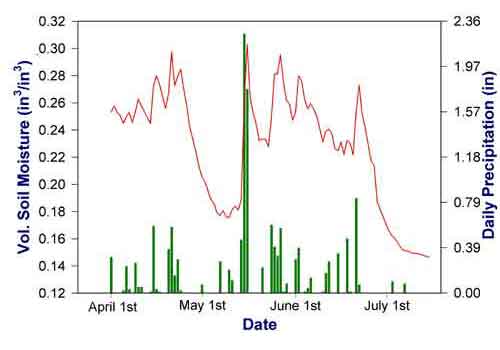
Figure 3. Hourly mean volumetric soil moisture (in3/in3) in the top 12 inches of the soil profile (under a 4-inch grass canopy) at Albion, MI 06:00, 26 June through 18:00, 28 June 2001. 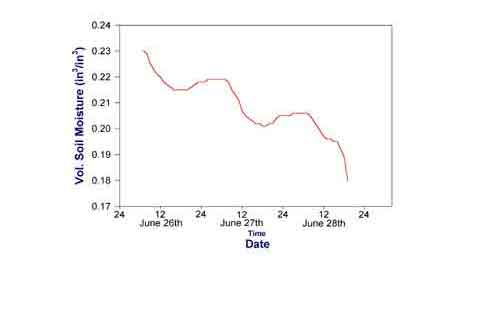
|