Michigan Climate Maps
Click on a map for larger version and regional text values.
Precipitation totals and departures are in inches; percent-of-normal maps are in percent. Temperatures are in degrees F.
Total Precipitation
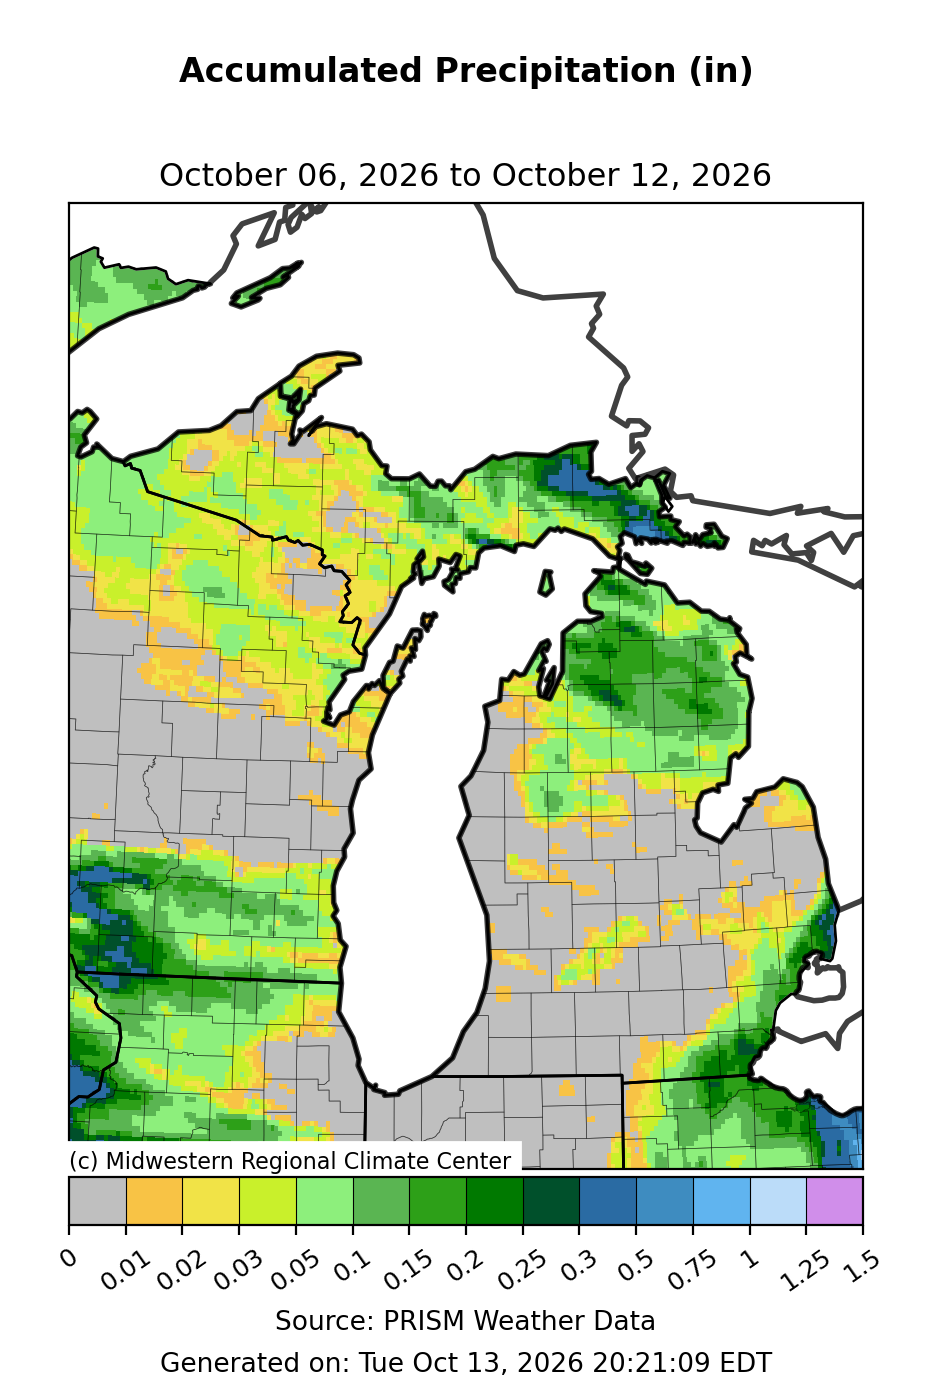
Text description: Total Precipitation, Past 7 days
October 6, 2026 to October 12, 2026
Western Upper Peninsula: the most frequent sampled color represents 0.03 to 0.05 inches. Central Upper Peninsula: the most frequent sampled color represents 0.03 to 0.05 inches. Eastern Upper Peninsula: the most frequent sampled color represents 0.15 to 0.2 inches. Northern Lower Peninsula: the most frequent sampled color represents 0.15 to 0.2 inches. Central Lower Peninsula: the most frequent sampled color represents 0 to 0.01 inches. Thumb: the most frequent sampled color represents 0 to 0.01 inches. Southern Lower Peninsula: the most frequent sampled color represents 0 to 0.01 inches.
Legend boundaries (inches): 0, 0.01, 0.02, 0.03, 0.05, 0.1, 0.15, 0.2, 0.25, 0.3, 0.5, 0.75, 1, 1.25, 1.5.
Approximate color-band samples from seven Michigan regions in this exact map image. These are not station measurements, regional averages, or full-region minima and maxima. Shared colors span multiple legend intervals; those intervals are combined. The underlying gridded numbers are not supplied with the image.
Midwestern Regional Climate Center · PRISM Weather Data. Generated Tue Oct 13, 2026 20:21:09 EDT.
Updated .
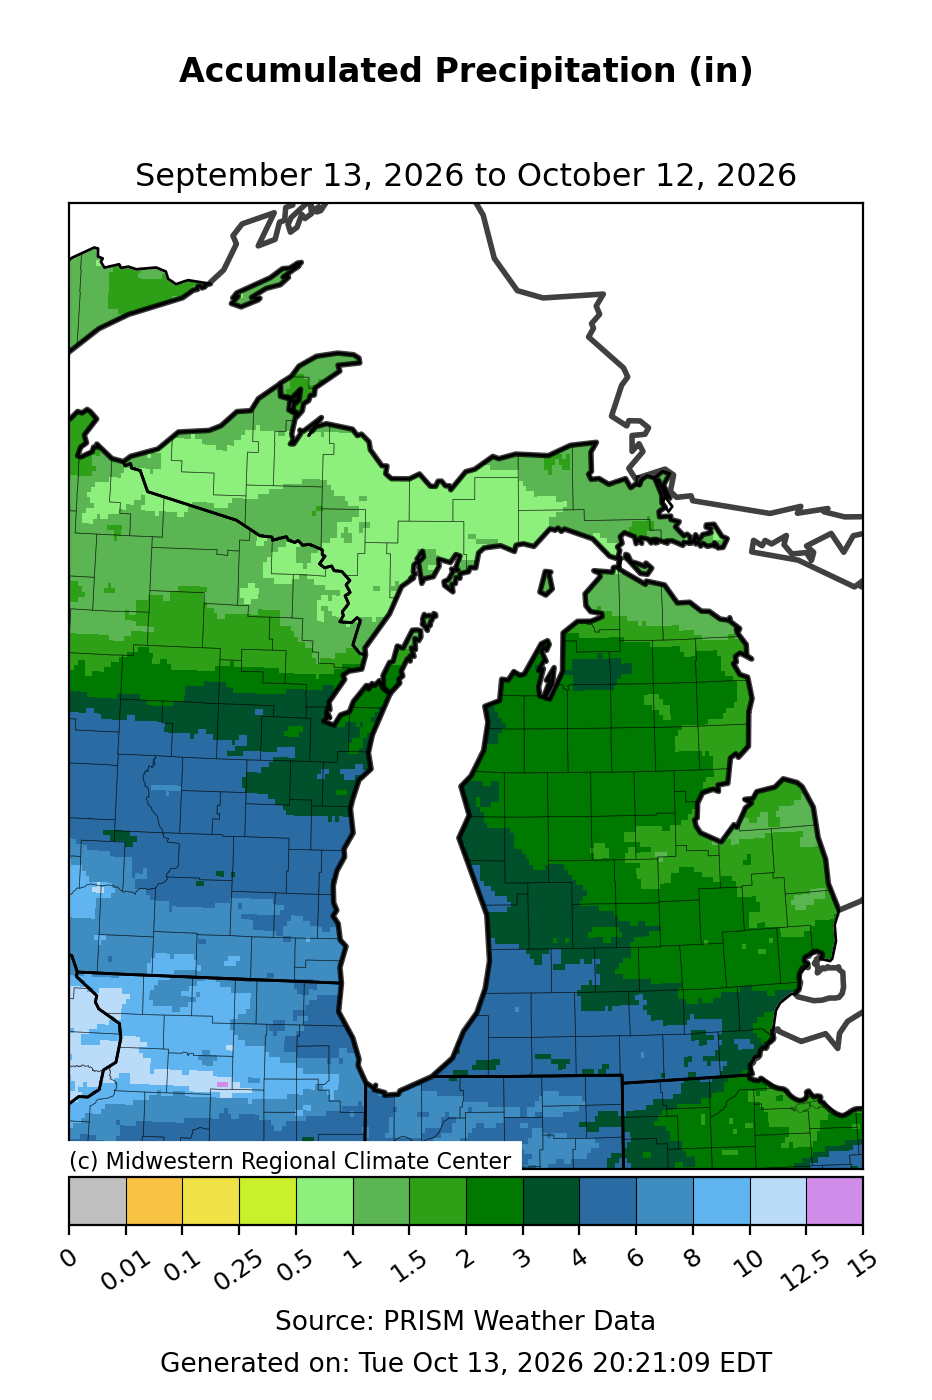
Text description: Total Precipitation, Past 30 days
September 13, 2026 to October 12, 2026
Western Upper Peninsula: the most frequent sampled color represents 0.5 to 1 inches. Central Upper Peninsula: the most frequent sampled color represents 0.5 to 1 inches. Eastern Upper Peninsula: the most frequent sampled color represents 1 to 1.5 inches. Northern Lower Peninsula: the most frequent sampled color represents 2 to 3 inches. Central Lower Peninsula: the most frequent sampled color represents 2 to 3 inches. Thumb: the most frequent sampled color represents 1.5 to 2 inches. Southern Lower Peninsula: the most frequent sampled color represents 4 to 6 inches.
Legend boundaries (inches): 0, 0.01, 0.1, 0.25, 0.5, 1, 1.5, 2, 3, 4, 6, 8, 10, 12.5, 15.
Approximate color-band samples from seven Michigan regions in this exact map image. These are not station measurements, regional averages, or full-region minima and maxima. Shared colors span multiple legend intervals; those intervals are combined. The underlying gridded numbers are not supplied with the image.
Midwestern Regional Climate Center · PRISM Weather Data. Generated Tue Oct 13, 2026 20:21:09 EDT.
Updated .
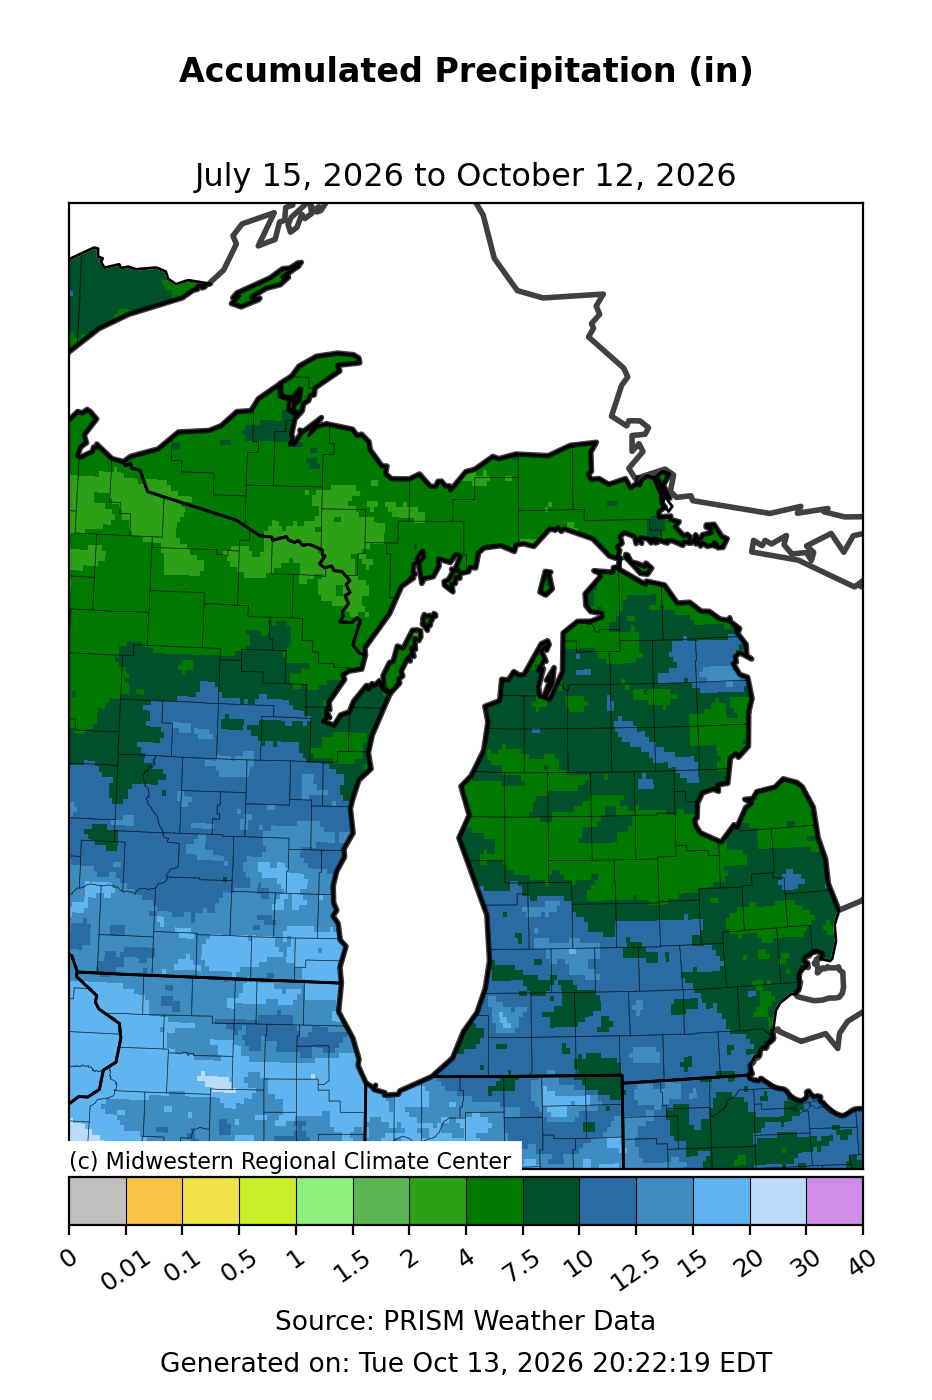
Text description: Total Precipitation, Past 90 days
July 15, 2026 to October 12, 2026
Western Upper Peninsula: the most frequent sampled color represents 4 to 7.5 inches. Central Upper Peninsula: the most frequent sampled color represents 4 to 7.5 inches. Eastern Upper Peninsula: the most frequent sampled color represents 4 to 7.5 inches. Northern Lower Peninsula: the most frequent sampled color represents 7.5 to 10 inches. Central Lower Peninsula: the most frequent sampled color represents 4 to 7.5 inches. Thumb: the most frequent sampled color represents 4 to 7.5 inches. Southern Lower Peninsula: the most frequent sampled color represents 10 to 12.5 inches.
Legend boundaries (inches): 0, 0.01, 0.1, 0.5, 1, 1.5, 2, 4, 7.5, 10, 12.5, 15, 20, 30, 40.
Approximate color-band samples from seven Michigan regions in this exact map image. These are not station measurements, regional averages, or full-region minima and maxima. Shared colors span multiple legend intervals; those intervals are combined. The underlying gridded numbers are not supplied with the image.
Midwestern Regional Climate Center · PRISM Weather Data. Generated Tue Oct 13, 2026 20:22:19 EDT.
Updated .
Total Precipitation - Departure from Mean
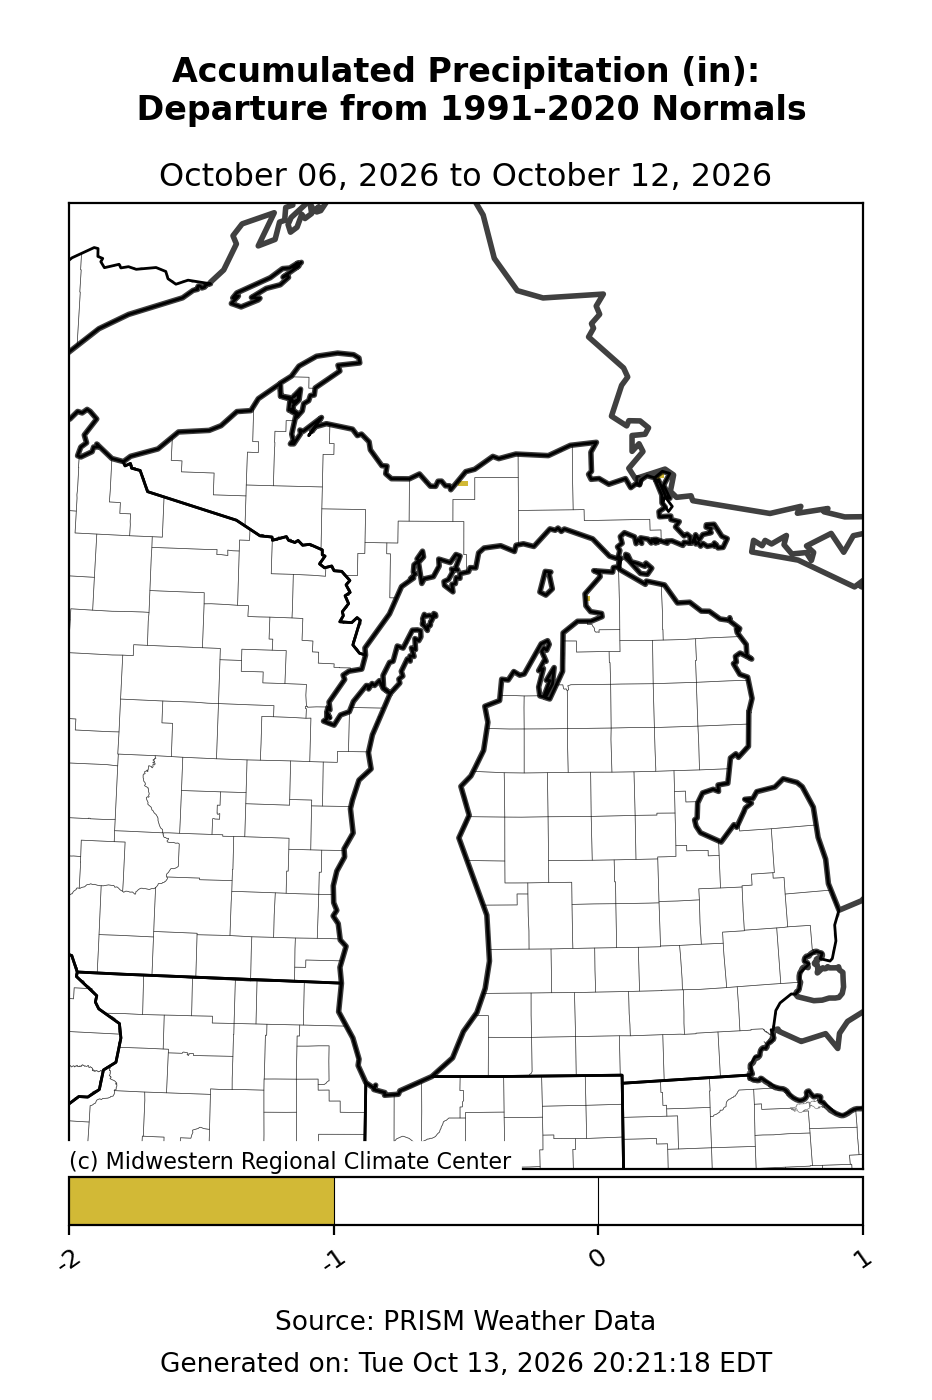
Text description: Total Precipitation - Departure from Mean, Past 7 days
October 6, 2026 to October 12, 2026
Western Upper Peninsula: the most frequent sampled color represents -1 to 1 inches. Central Upper Peninsula: the most frequent sampled color represents -1 to 1 inches. Eastern Upper Peninsula: the most frequent sampled color represents -1 to 1 inches. Northern Lower Peninsula: the most frequent sampled color represents -1 to 1 inches. Central Lower Peninsula: the most frequent sampled color represents -1 to 1 inches. Thumb: the most frequent sampled color represents -1 to 1 inches. Southern Lower Peninsula: the most frequent sampled color represents -1 to 1 inches.
Legend boundaries (inches): -2, -1, 0, 1.
Approximate color-band samples from seven Michigan regions in this exact map image. These are not station measurements, regional averages, or full-region minima and maxima. Shared colors span multiple legend intervals; those intervals are combined. The underlying gridded numbers are not supplied with the image.
Midwestern Regional Climate Center · PRISM Weather Data. Generated Tue Oct 13, 2026 20:21:18 EDT.
Updated .
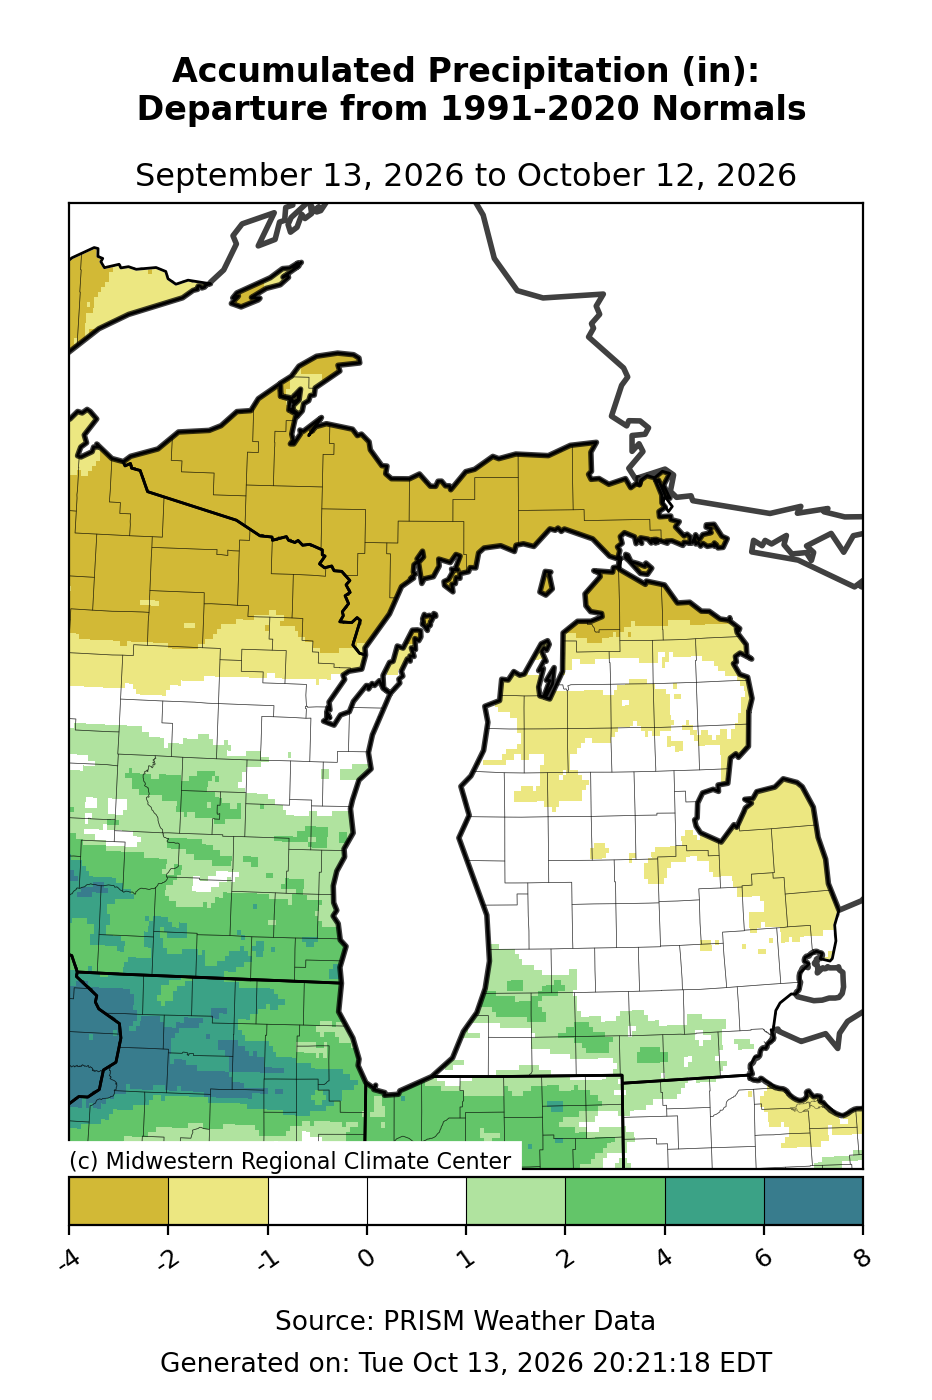
Text description: Total Precipitation - Departure from Mean, Past 30 days
September 13, 2026 to October 12, 2026
Western Upper Peninsula: the most frequent sampled color represents -4 to -2 inches. Central Upper Peninsula: the most frequent sampled color represents -4 to -2 inches. Eastern Upper Peninsula: the most frequent sampled color represents -4 to -2 inches. Northern Lower Peninsula: the most frequent sampled color represents -2 to -1 inches. Central Lower Peninsula: the most frequent sampled color represents -1 to 1 inches. Thumb: the most frequent sampled color represents -2 to -1 inches. Southern Lower Peninsula: the most frequent sampled color represents -1 to 1 inches.
Legend boundaries (inches): -4, -2, -1, 0, 1, 2, 4, 6, 8.
Approximate color-band samples from seven Michigan regions in this exact map image. These are not station measurements, regional averages, or full-region minima and maxima. Shared colors span multiple legend intervals; those intervals are combined. The underlying gridded numbers are not supplied with the image.
Midwestern Regional Climate Center · PRISM Weather Data. Generated Tue Oct 13, 2026 20:21:18 EDT.
Updated .
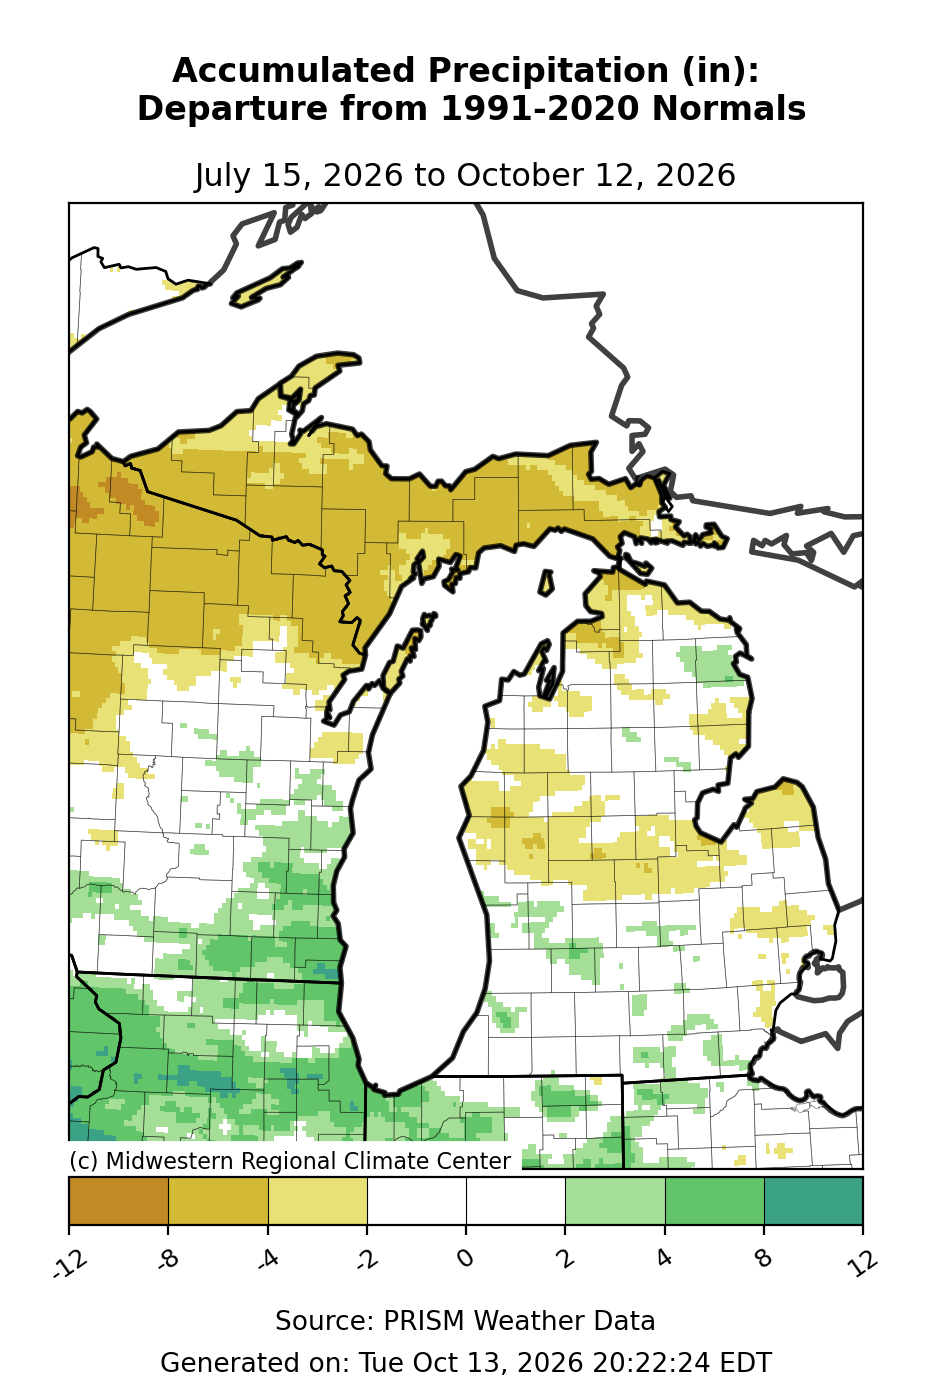
Text description: Total Precipitation - Departure from Mean, Past 90 days
July 15, 2026 to October 12, 2026
Western Upper Peninsula: the most frequent sampled color represents -8 to -4 inches. Central Upper Peninsula: the most frequent sampled color represents -8 to -4 inches. Eastern Upper Peninsula: the most frequent sampled color represents -8 to -4 inches. Northern Lower Peninsula: the most frequent sampled color represents -2 to 2 inches. Central Lower Peninsula: the most frequent sampled color represents -4 to -2 inches. Thumb: the most frequent sampled color represents -4 to -2 inches. Southern Lower Peninsula: the most frequent sampled color represents -2 to 2 inches.
Legend boundaries (inches): -12, -8, -4, -2, 0, 2, 4, 8, 12.
Approximate color-band samples from seven Michigan regions in this exact map image. These are not station measurements, regional averages, or full-region minima and maxima. Shared colors span multiple legend intervals; those intervals are combined. The underlying gridded numbers are not supplied with the image.
Midwestern Regional Climate Center · PRISM Weather Data. Generated Tue Oct 13, 2026 20:22:24 EDT.
Updated .
Total Precipitation - Percent of Mean
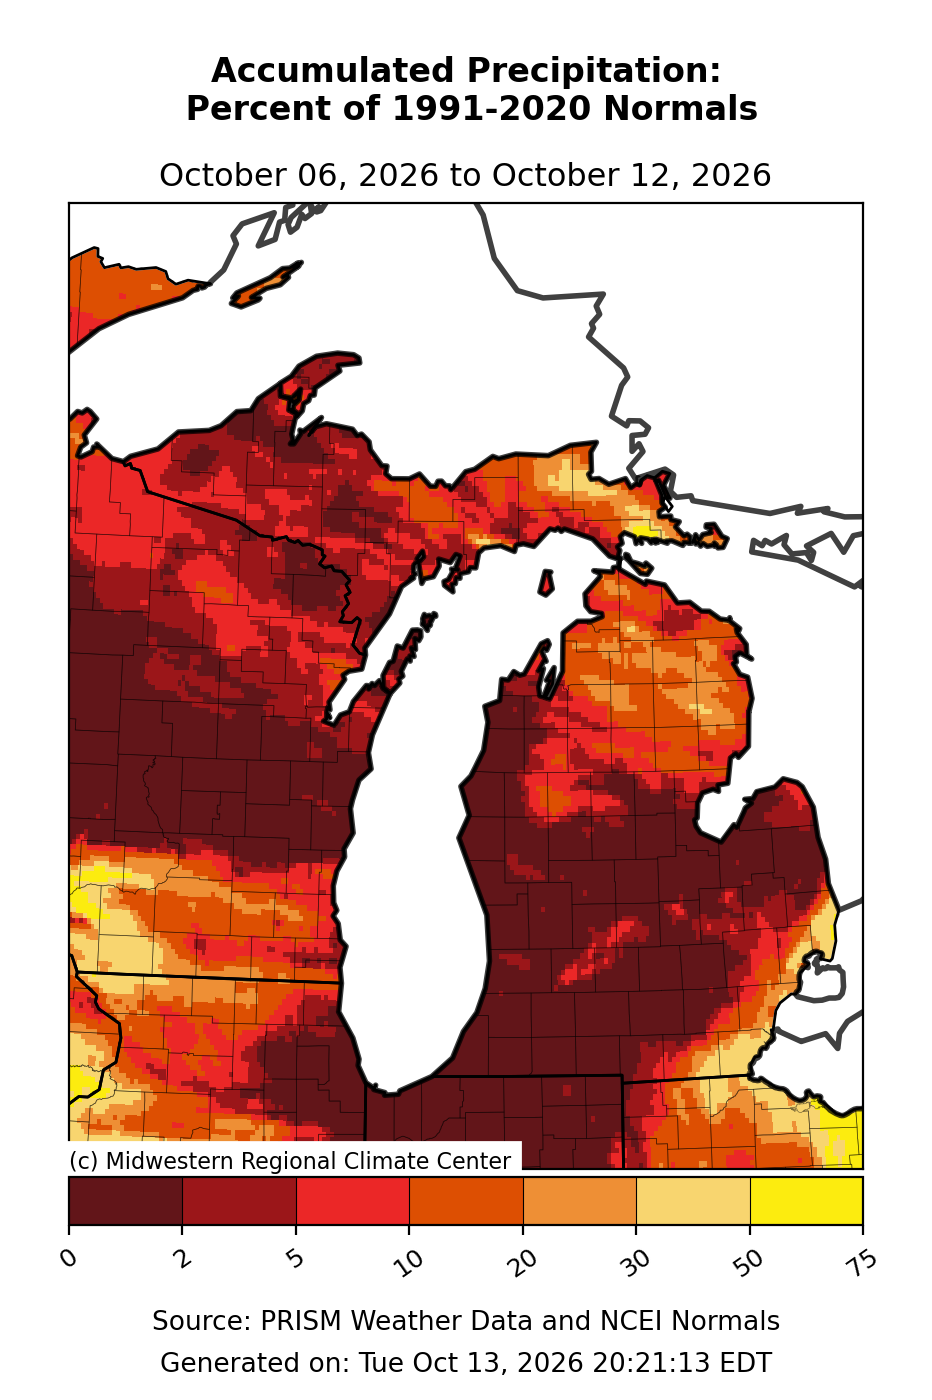
Text description: Total Precipitation - Percent of Mean, Past 7 days
October 6, 2026 to October 12, 2026
Western Upper Peninsula: the most frequent sampled color represents 2 to 5 percent of normal. Central Upper Peninsula: the most frequent sampled color represents 2 to 5 percent of normal. Eastern Upper Peninsula: the most frequent sampled color represents 10 to 20 percent of normal. Northern Lower Peninsula: the most frequent sampled color represents 20 to 30 percent of normal. Central Lower Peninsula: the most frequent sampled color represents 0 to 2 percent of normal. Thumb: the most frequent sampled color represents 0 to 2 percent of normal. Southern Lower Peninsula: the most frequent sampled color represents 0 to 2 percent of normal.
Legend boundaries (percent of normal): 0, 2, 5, 10, 20, 30, 50, 75.
Approximate color-band samples from seven Michigan regions in this exact map image. These are not station measurements, regional averages, or full-region minima and maxima. Shared colors span multiple legend intervals; those intervals are combined. The underlying gridded numbers are not supplied with the image.
Midwestern Regional Climate Center · PRISM Weather Data. Generated Tue Oct 13, 2026 20:21:13 EDT.
Updated .
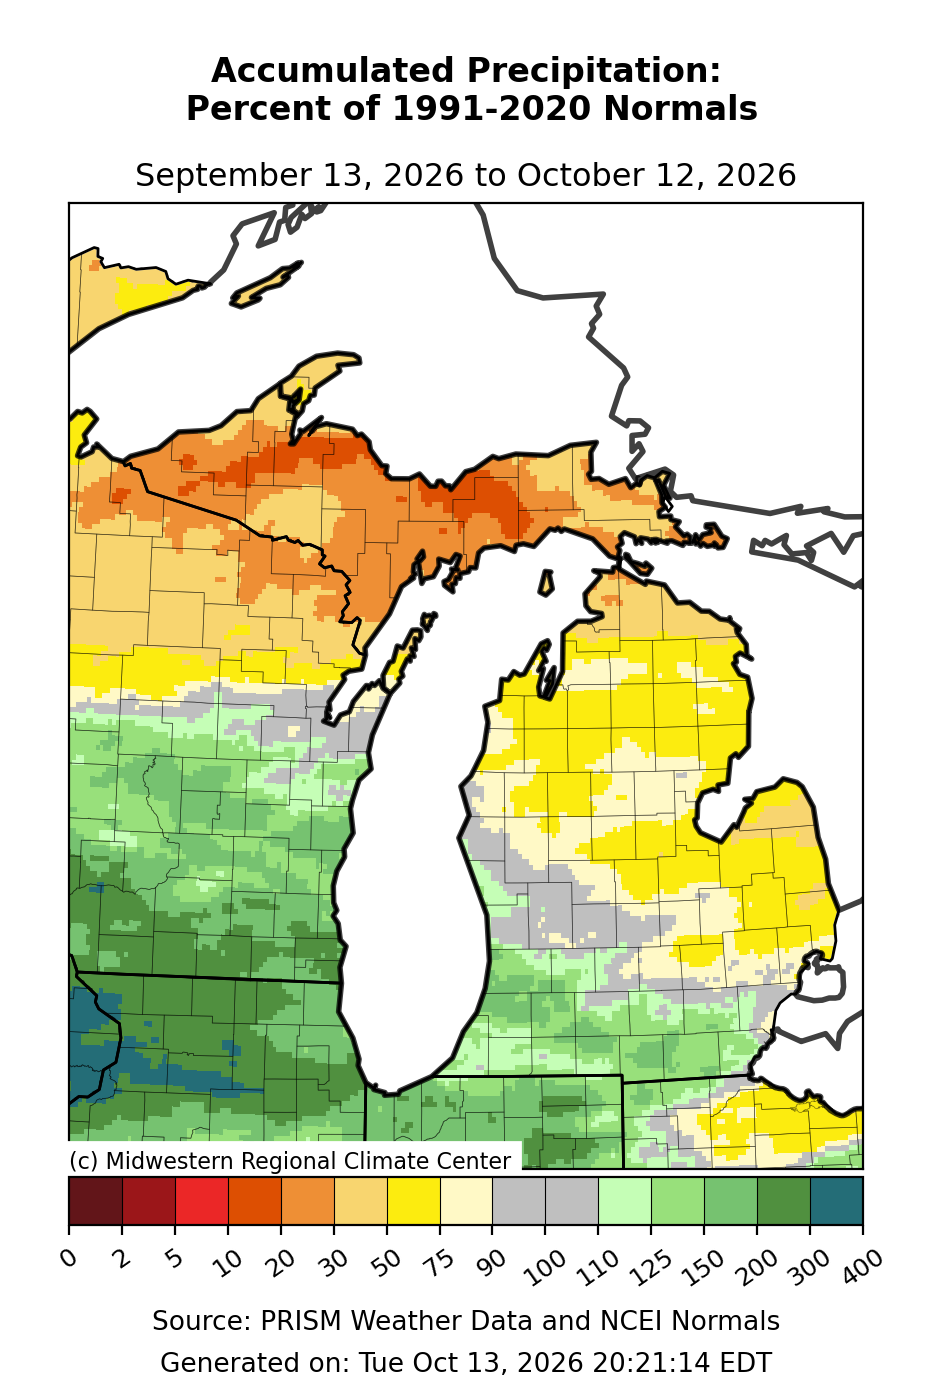
Text description: Total Precipitation - Percent of Mean, Past 30 days
September 13, 2026 to October 12, 2026
Western Upper Peninsula: the most frequent sampled color represents 10 to 20 percent of normal. Central Upper Peninsula: the most frequent sampled color represents 20 to 30 percent of normal. Eastern Upper Peninsula: the most frequent sampled color represents 30 to 50 percent of normal. Northern Lower Peninsula: the most frequent sampled color represents 50 to 75 percent of normal. Central Lower Peninsula: the most frequent sampled color represents 50 to 75 percent of normal. Thumb: the most frequent sampled color represents 50 to 75 percent of normal. Southern Lower Peninsula: the most frequent sampled color represents 75 to 90 percent of normal.
Legend boundaries (percent of normal): 0, 2, 5, 10, 20, 30, 50, 75, 90, 100, 110, 125, 150, 200, 300, 400.
Approximate color-band samples from seven Michigan regions in this exact map image. These are not station measurements, regional averages, or full-region minima and maxima. Shared colors span multiple legend intervals; those intervals are combined. The underlying gridded numbers are not supplied with the image.
Midwestern Regional Climate Center · PRISM Weather Data. Generated Tue Oct 13, 2026 20:21:14 EDT.
Updated .
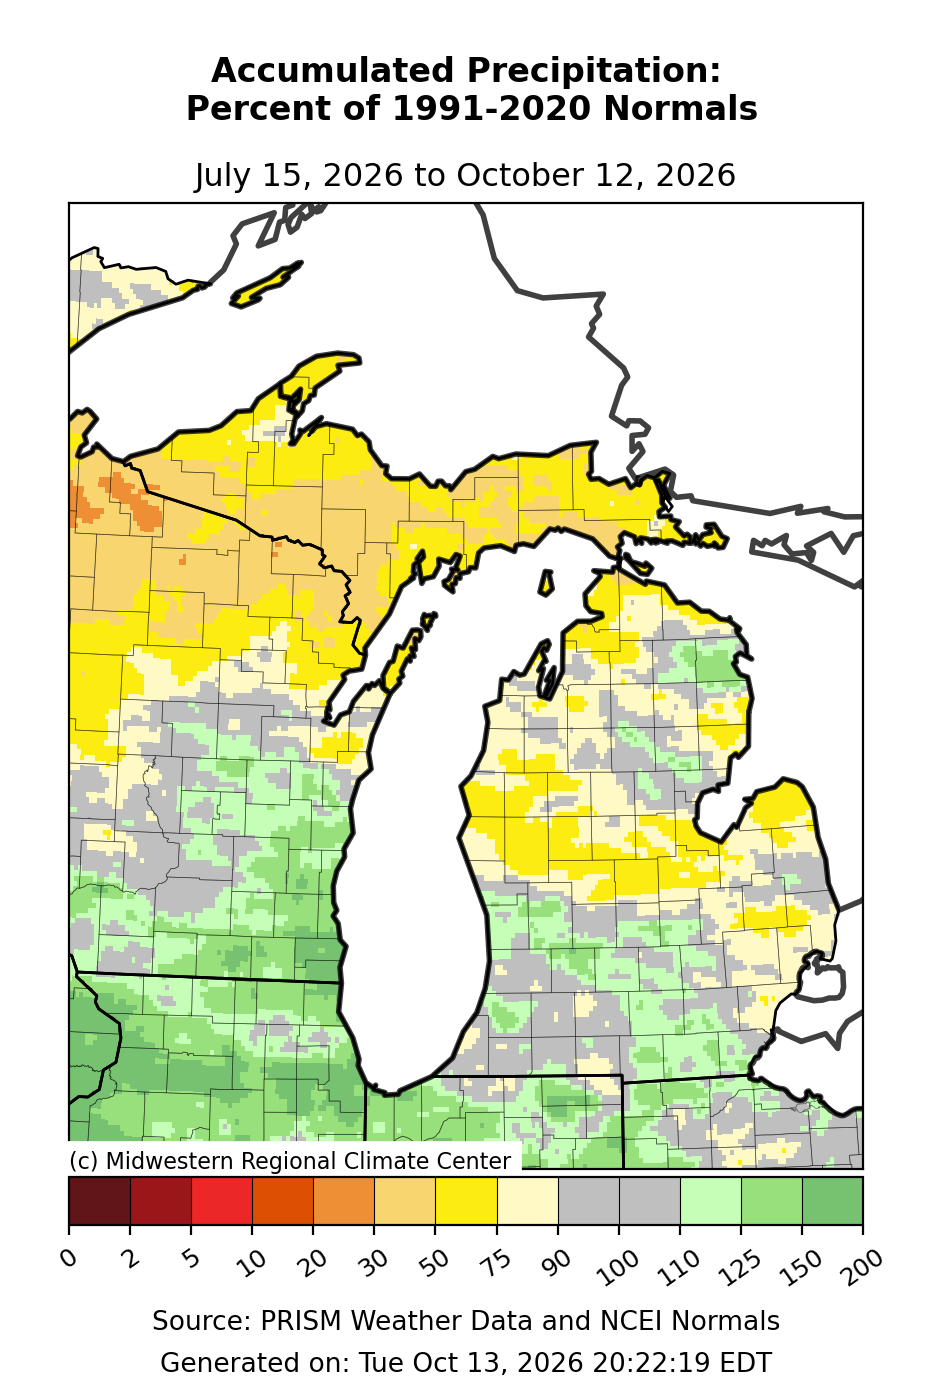
Text description: Total Precipitation - Percent of Mean, Past 90 days
July 15, 2026 to October 12, 2026
Western Upper Peninsula: the most frequent sampled color represents 50 to 75 percent of normal. Central Upper Peninsula: the most frequent sampled color represents 30 to 50 percent of normal. Eastern Upper Peninsula: the most frequent sampled color represents 50 to 75 percent of normal. Northern Lower Peninsula: the most frequent sampled color represents 90 to 110 percent of normal. Central Lower Peninsula: the most frequent sampled color represents 50 to 75 percent of normal. Thumb: the most frequent sampled color represents 50 to 75 percent of normal. Southern Lower Peninsula: the most frequent sampled color represents 90 to 110 percent of normal.
Legend boundaries (percent of normal): 0, 2, 5, 10, 20, 30, 50, 75, 90, 100, 110, 125, 150, 200.
Approximate color-band samples from seven Michigan regions in this exact map image. These are not station measurements, regional averages, or full-region minima and maxima. Shared colors span multiple legend intervals; those intervals are combined. The underlying gridded numbers are not supplied with the image.
Midwestern Regional Climate Center · PRISM Weather Data. Generated Tue Oct 13, 2026 20:22:19 EDT.
Updated .
Average High Temperature
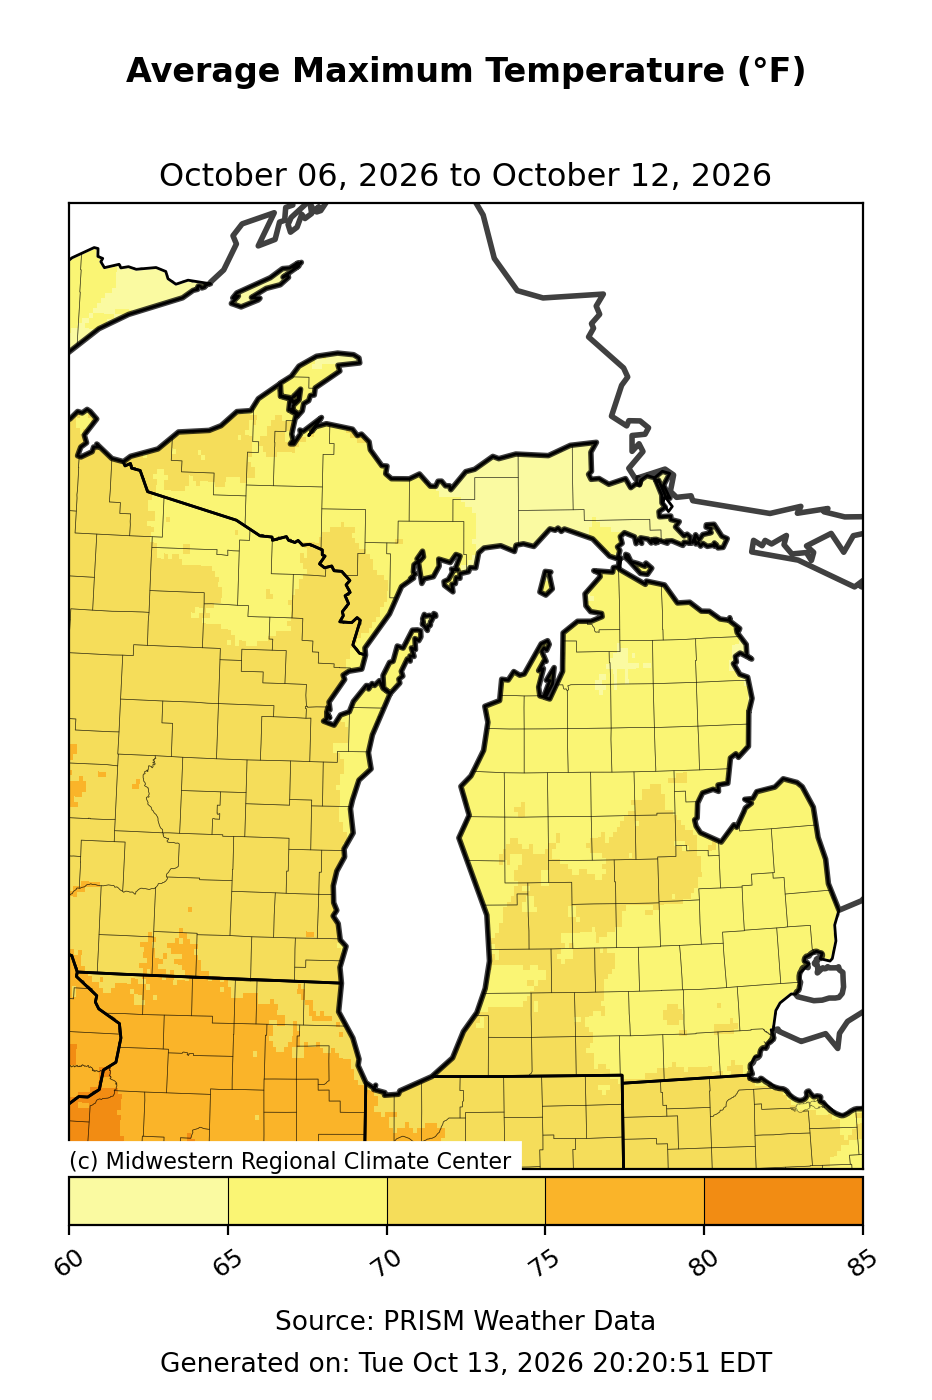
Text description: Average High Temperature, Past 7 days
October 6, 2026 to October 12, 2026
Western Upper Peninsula: the most frequent sampled color represents 65 to 70 degrees F. Central Upper Peninsula: the most frequent sampled color represents 65 to 70 degrees F. Eastern Upper Peninsula: the most frequent sampled color represents 60 to 65 degrees F. Northern Lower Peninsula: the most frequent sampled color represents 65 to 70 degrees F. Central Lower Peninsula: the most frequent sampled color represents 65 to 70 degrees F. Thumb: the most frequent sampled color represents 65 to 70 degrees F. Southern Lower Peninsula: the most frequent sampled color represents 65 to 70 degrees F.
Legend boundaries (degrees F): 60, 65, 70, 75, 80, 85.
Approximate color-band samples from seven Michigan regions in this exact map image. These are not station measurements, regional averages, or full-region minima and maxima. Shared colors span multiple legend intervals; those intervals are combined. The underlying gridded numbers are not supplied with the image.
Midwestern Regional Climate Center · PRISM Weather Data. Generated Tue Oct 13, 2026 20:20:51 EDT.
Updated .
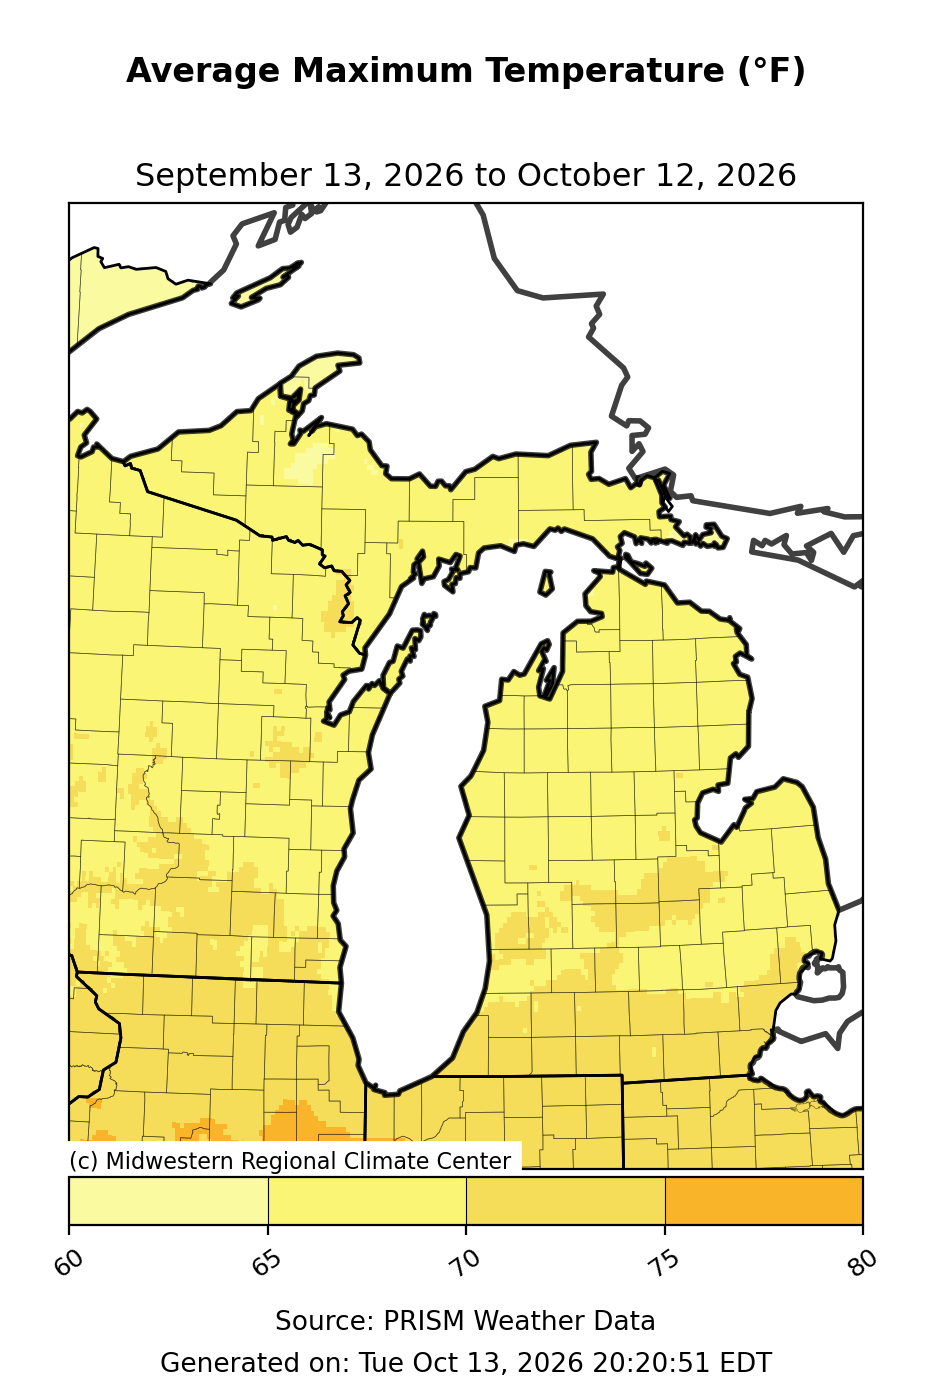
Text description: Average High Temperature, Past 30 days
September 13, 2026 to October 12, 2026
Western Upper Peninsula: the most frequent sampled color represents 65 to 70 degrees F. Central Upper Peninsula: the most frequent sampled color represents 65 to 70 degrees F. Eastern Upper Peninsula: the most frequent sampled color represents 65 to 70 degrees F. Northern Lower Peninsula: the most frequent sampled color represents 65 to 70 degrees F. Central Lower Peninsula: the most frequent sampled color represents 65 to 70 degrees F. Thumb: the most frequent sampled color represents 65 to 70 degrees F. Southern Lower Peninsula: the most frequent sampled color represents 70 to 75 degrees F.
Legend boundaries (degrees F): 60, 65, 70, 75, 80.
Approximate color-band samples from seven Michigan regions in this exact map image. These are not station measurements, regional averages, or full-region minima and maxima. Shared colors span multiple legend intervals; those intervals are combined. The underlying gridded numbers are not supplied with the image.
Midwestern Regional Climate Center · PRISM Weather Data. Generated Tue Oct 13, 2026 20:20:51 EDT.
Updated .
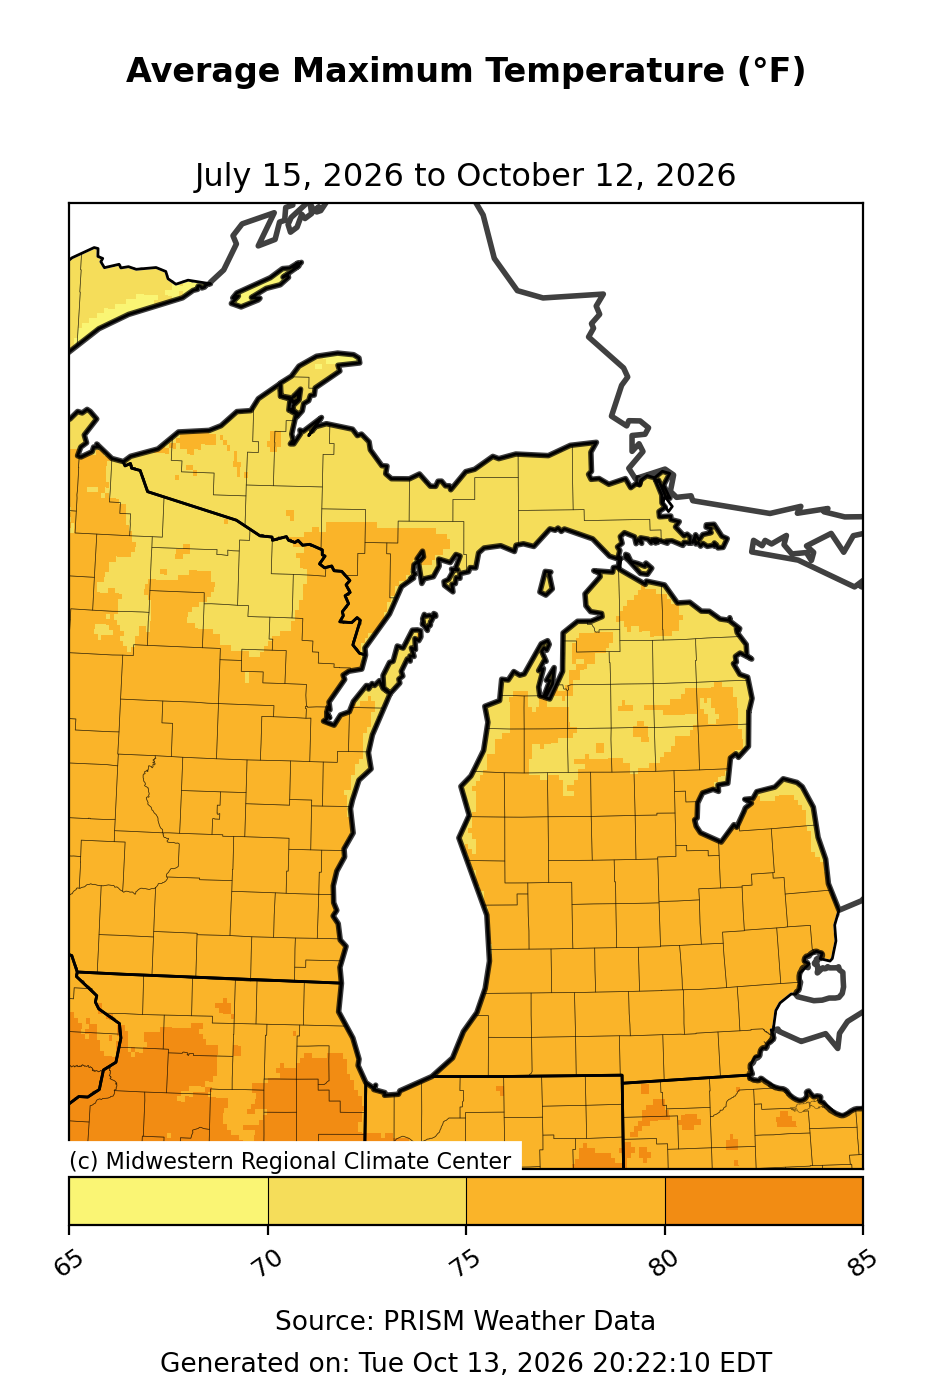
Text description: Average High Temperature, Past 90 days
July 15, 2026 to October 12, 2026
Western Upper Peninsula: the most frequent sampled color represents 70 to 75 degrees F. Central Upper Peninsula: the most frequent sampled color represents 70 to 75 degrees F. Eastern Upper Peninsula: the most frequent sampled color represents 70 to 75 degrees F. Northern Lower Peninsula: the most frequent sampled color represents 70 to 75 degrees F. Central Lower Peninsula: the most frequent sampled color represents 75 to 80 degrees F. Thumb: the most frequent sampled color represents 75 to 80 degrees F. Southern Lower Peninsula: the most frequent sampled color represents 75 to 80 degrees F.
Legend boundaries (degrees F): 65, 70, 75, 80, 85.
Approximate color-band samples from seven Michigan regions in this exact map image. These are not station measurements, regional averages, or full-region minima and maxima. Shared colors span multiple legend intervals; those intervals are combined. The underlying gridded numbers are not supplied with the image.
Midwestern Regional Climate Center · PRISM Weather Data. Generated Tue Oct 13, 2026 20:22:10 EDT.
Updated .
Average High Temperature - Departure from Mean
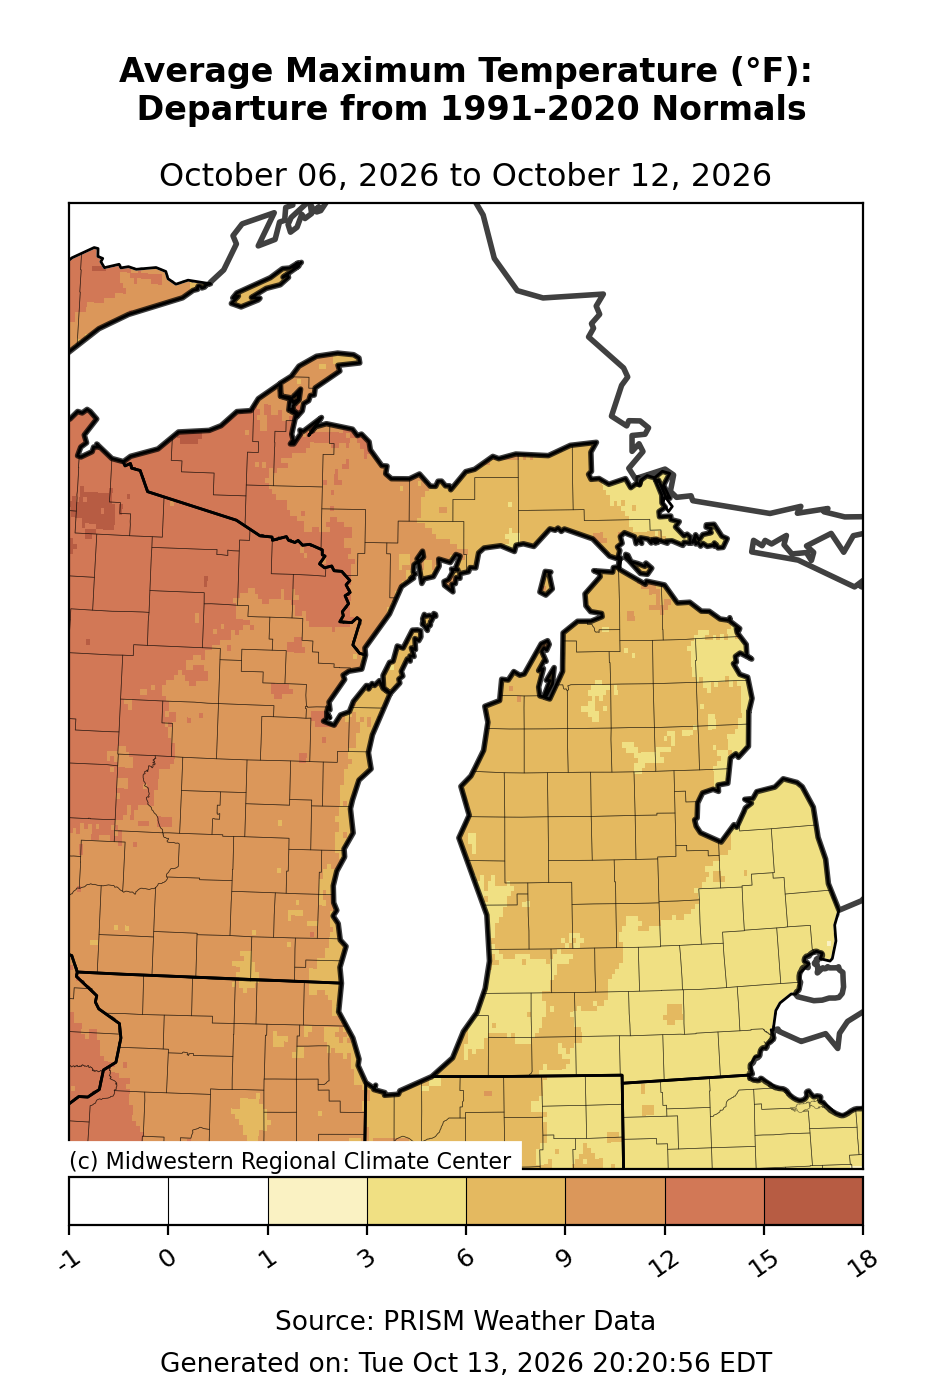
Text description: Average High Temperature - Departure from Mean, Past 7 days
October 6, 2026 to October 12, 2026
Western Upper Peninsula: the most frequent sampled color represents 9 to 12 degrees F. Central Upper Peninsula: the most frequent sampled color represents 6 to 9 degrees F. Eastern Upper Peninsula: the most frequent sampled color represents 6 to 9 degrees F. Northern Lower Peninsula: the most frequent sampled color represents 6 to 9 degrees F. Central Lower Peninsula: the most frequent sampled color represents 6 to 9 degrees F. Thumb: the most frequent sampled color represents 3 to 6 degrees F. Southern Lower Peninsula: the most frequent sampled color represents 3 to 6 degrees F.
Legend boundaries (degrees F): -1, 0, 1, 3, 6, 9, 12, 15, 18.
Approximate color-band samples from seven Michigan regions in this exact map image. These are not station measurements, regional averages, or full-region minima and maxima. Shared colors span multiple legend intervals; those intervals are combined. The underlying gridded numbers are not supplied with the image.
Midwestern Regional Climate Center · PRISM Weather Data. Generated Tue Oct 13, 2026 20:20:56 EDT.
Updated .
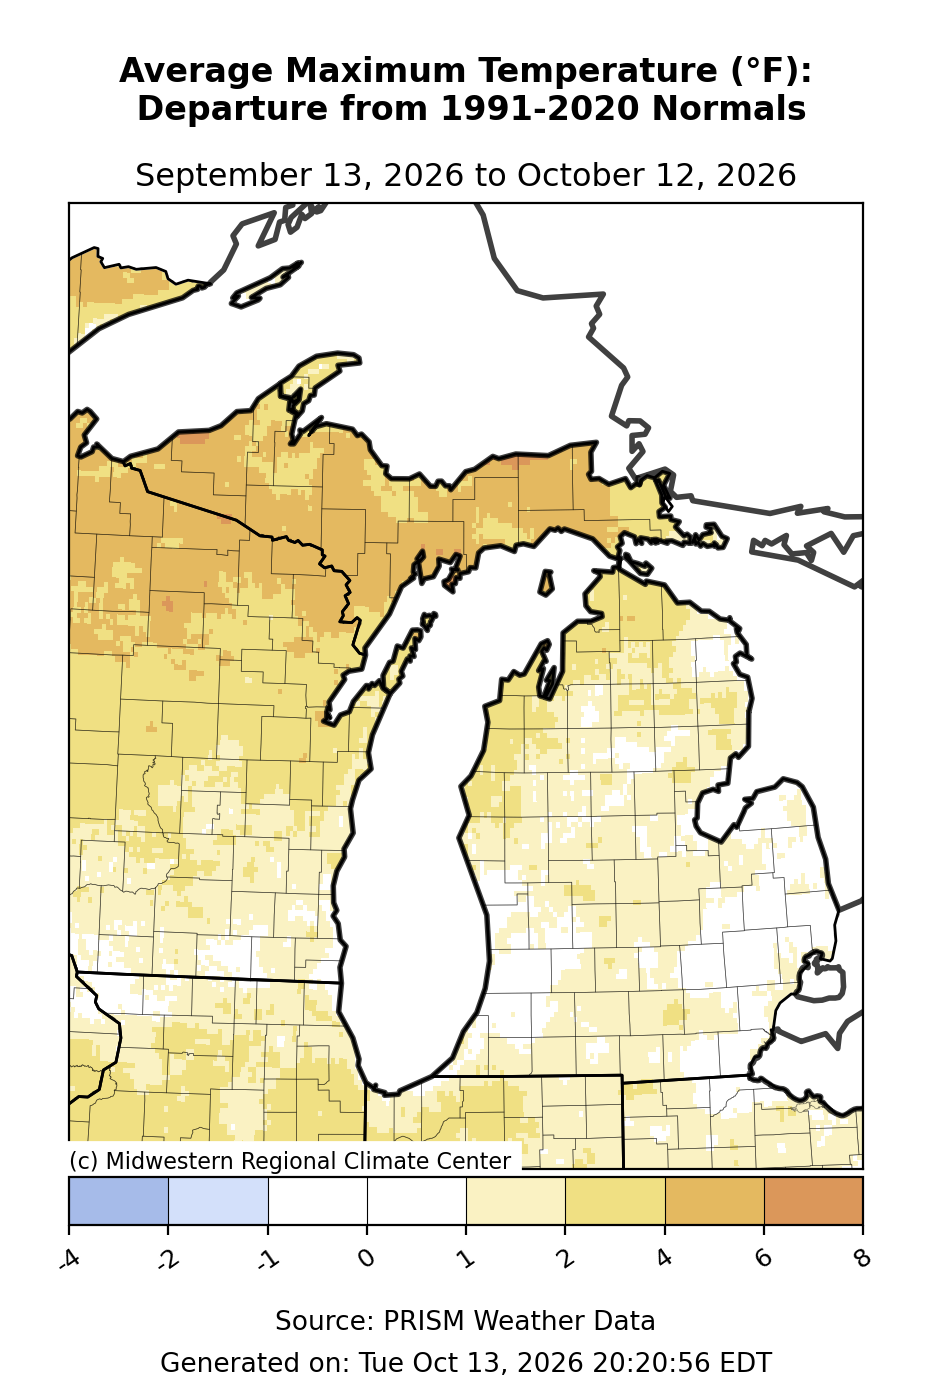
Text description: Average High Temperature - Departure from Mean, Past 30 days
September 13, 2026 to October 12, 2026
Western Upper Peninsula: the most frequent sampled color represents 4 to 6 degrees F. Central Upper Peninsula: the most frequent sampled color represents 4 to 6 degrees F. Eastern Upper Peninsula: the most frequent sampled color represents 4 to 6 degrees F. Northern Lower Peninsula: the most frequent sampled color represents 1 to 2 degrees F. Central Lower Peninsula: the most frequent sampled color represents 1 to 2 degrees F. Thumb: the most frequent sampled color represents -1 to 1 degrees F. Southern Lower Peninsula: the most frequent sampled color represents 1 to 2 degrees F.
Legend boundaries (degrees F): -4, -2, -1, 0, 1, 2, 4, 6, 8.
Approximate color-band samples from seven Michigan regions in this exact map image. These are not station measurements, regional averages, or full-region minima and maxima. Shared colors span multiple legend intervals; those intervals are combined. The underlying gridded numbers are not supplied with the image.
Midwestern Regional Climate Center · PRISM Weather Data. Generated Tue Oct 13, 2026 20:20:56 EDT.
Updated .
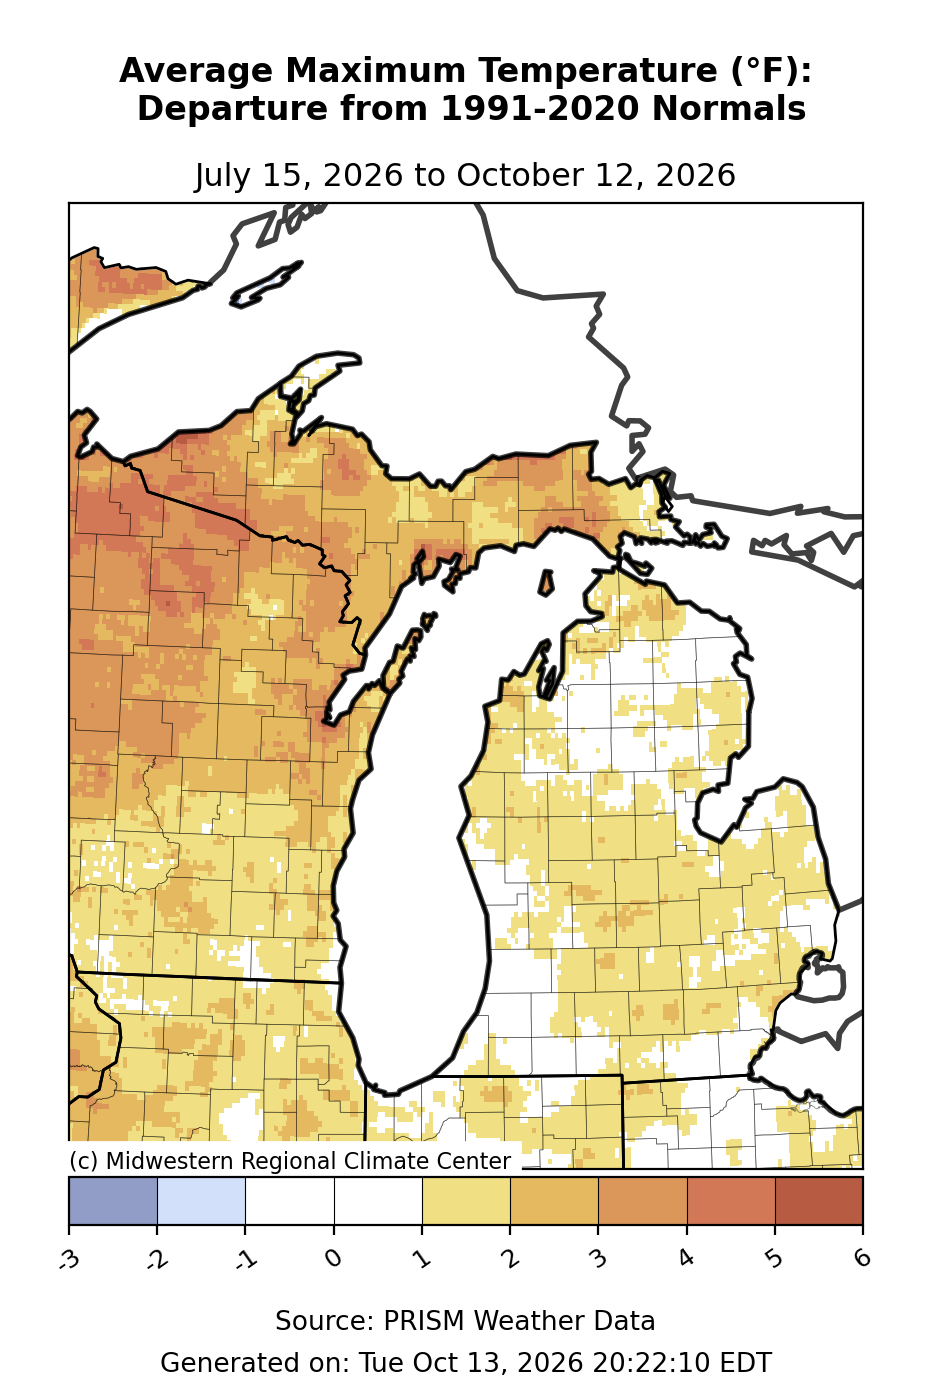
Text description: Average High Temperature - Departure from Mean, Past 90 days
July 15, 2026 to October 12, 2026
Western Upper Peninsula: the most frequent sampled color represents 2 to 3 degrees F. Central Upper Peninsula: the most frequent sampled color represents 2 to 3 degrees F. Eastern Upper Peninsula: the most frequent sampled color represents 3 to 4 degrees F. Northern Lower Peninsula: the most frequent sampled color represents -1 to 1 degrees F. Central Lower Peninsula: the most frequent sampled color represents 1 to 2 degrees F. Thumb: the most frequent sampled color represents -1 to 1 degrees F. Southern Lower Peninsula: the most frequent sampled color represents 1 to 2 degrees F.
Legend boundaries (degrees F): -3, -2, -1, 0, 1, 2, 3, 4, 5, 6.
Approximate color-band samples from seven Michigan regions in this exact map image. These are not station measurements, regional averages, or full-region minima and maxima. Shared colors span multiple legend intervals; those intervals are combined. The underlying gridded numbers are not supplied with the image.
Midwestern Regional Climate Center · PRISM Weather Data. Generated Tue Oct 13, 2026 20:22:10 EDT.
Updated .
Average Temperature
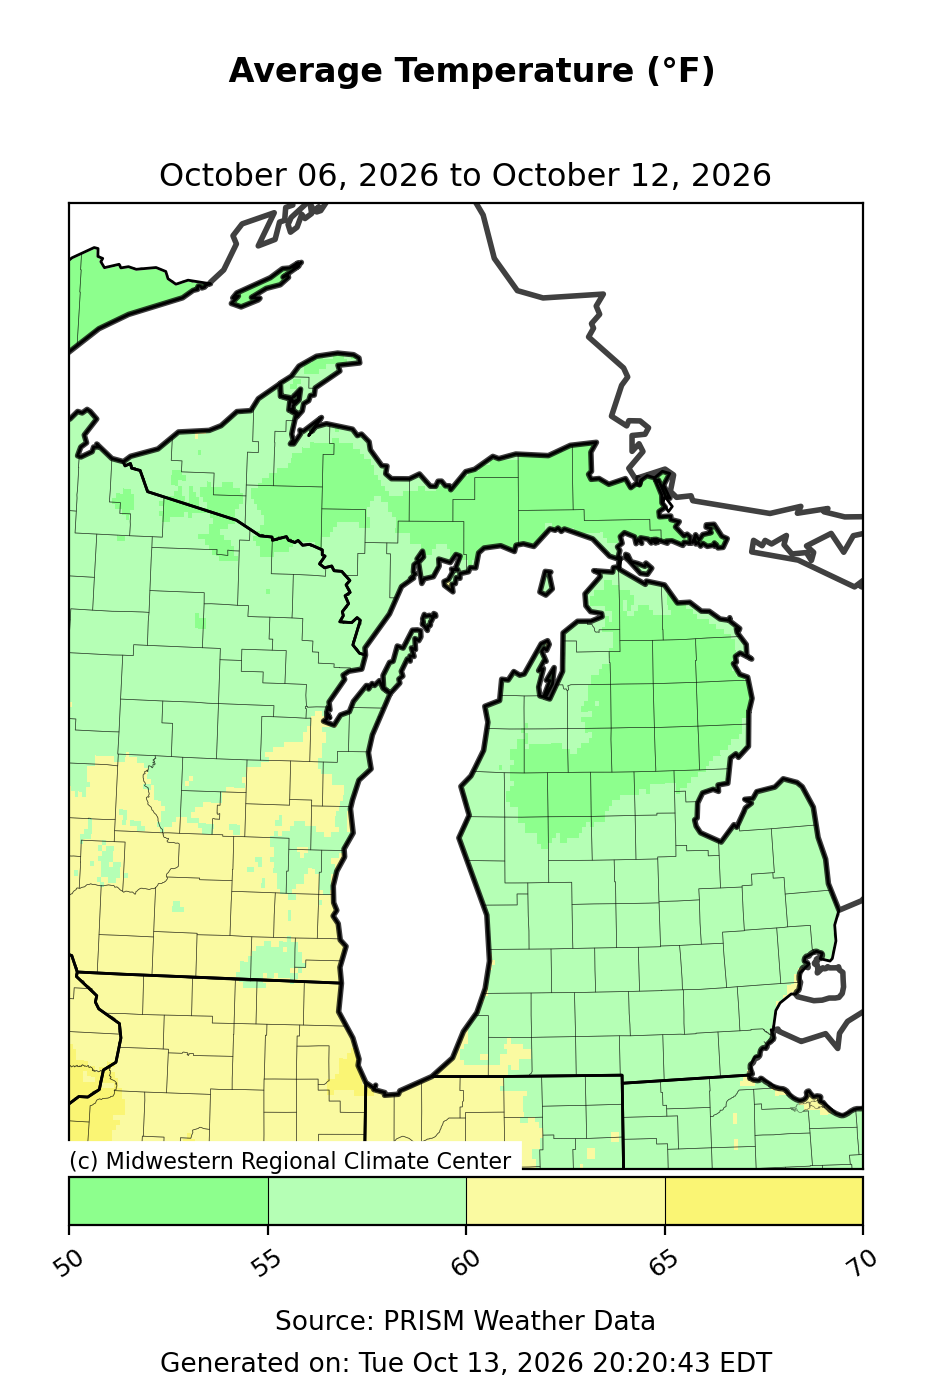
Text description: Average Temperature, Past 7 days
October 6, 2026 to October 12, 2026
Western Upper Peninsula: the most frequent sampled color represents 50 to 55 degrees F. Central Upper Peninsula: the most frequent sampled color represents 50 to 55 degrees F. Eastern Upper Peninsula: the most frequent sampled color represents 50 to 55 degrees F. Northern Lower Peninsula: the most frequent sampled color represents 50 to 55 degrees F. Central Lower Peninsula: the most frequent sampled color represents 55 to 60 degrees F. Thumb: the most frequent sampled color represents 55 to 60 degrees F. Southern Lower Peninsula: the most frequent sampled color represents 55 to 60 degrees F.
Legend boundaries (degrees F): 50, 55, 60, 65, 70.
Approximate color-band samples from seven Michigan regions in this exact map image. These are not station measurements, regional averages, or full-region minima and maxima. Shared colors span multiple legend intervals; those intervals are combined. The underlying gridded numbers are not supplied with the image.
Midwestern Regional Climate Center · PRISM Weather Data. Generated Tue Oct 13, 2026 20:20:43 EDT.
Updated .
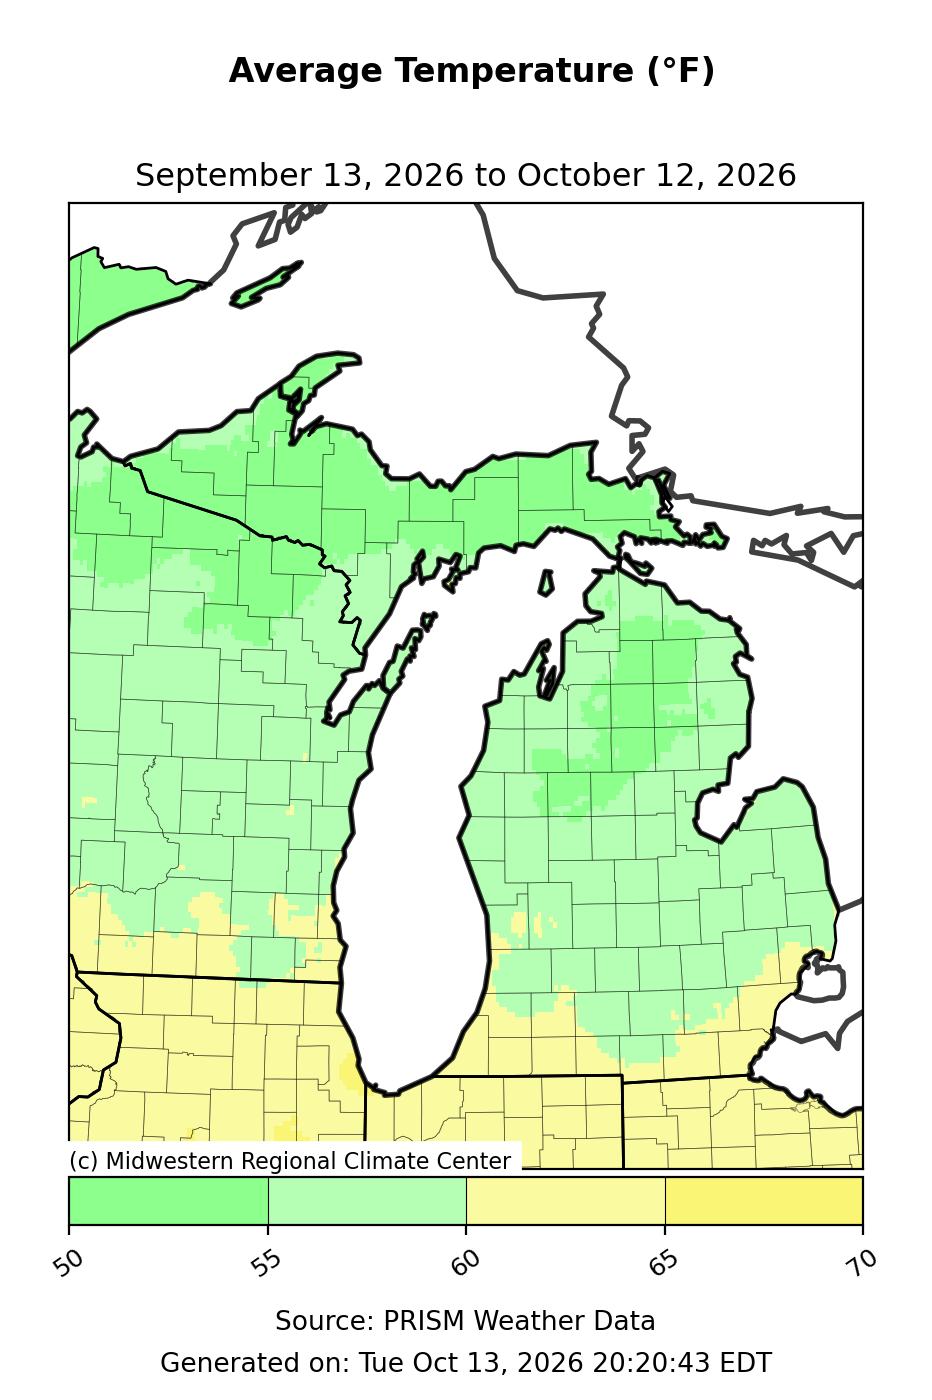
Text description: Average Temperature, Past 30 days
September 13, 2026 to October 12, 2026
Western Upper Peninsula: the most frequent sampled color represents 50 to 55 degrees F. Central Upper Peninsula: the most frequent sampled color represents 50 to 55 degrees F. Eastern Upper Peninsula: the most frequent sampled color represents 50 to 55 degrees F. Northern Lower Peninsula: the most frequent sampled color represents 50 to 55 degrees F. Central Lower Peninsula: the most frequent sampled color represents 55 to 60 degrees F. Thumb: the most frequent sampled color represents 55 to 60 degrees F. Southern Lower Peninsula: the most frequent sampled color represents 55 to 60 degrees F.
Legend boundaries (degrees F): 50, 55, 60, 65, 70.
Approximate color-band samples from seven Michigan regions in this exact map image. These are not station measurements, regional averages, or full-region minima and maxima. Shared colors span multiple legend intervals; those intervals are combined. The underlying gridded numbers are not supplied with the image.
Midwestern Regional Climate Center · PRISM Weather Data. Generated Tue Oct 13, 2026 20:20:43 EDT.
Updated .
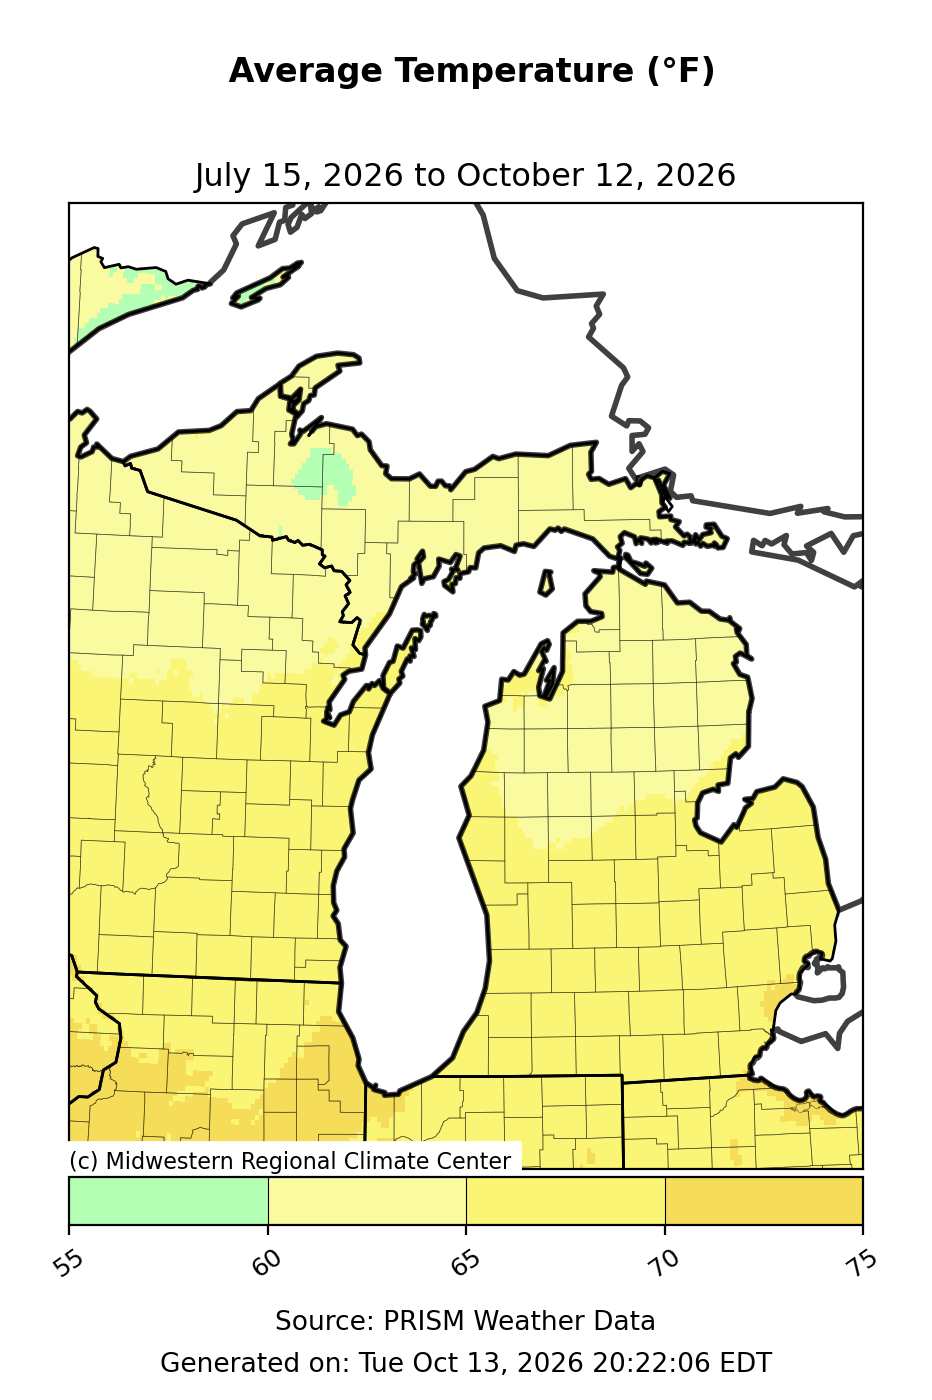
Text description: Average Temperature, Past 90 days
July 15, 2026 to October 12, 2026
Western Upper Peninsula: the most frequent sampled color represents 55 to 60 degrees F. Central Upper Peninsula: the most frequent sampled color represents 60 to 65 degrees F. Eastern Upper Peninsula: the most frequent sampled color represents 60 to 65 degrees F. Northern Lower Peninsula: the most frequent sampled color represents 60 to 65 degrees F. Central Lower Peninsula: the most frequent sampled color represents 60 to 65 degrees F. Thumb: the most frequent sampled color represents 65 to 70 degrees F. Southern Lower Peninsula: the most frequent sampled color represents 65 to 70 degrees F.
Legend boundaries (degrees F): 55, 60, 65, 70, 75.
Approximate color-band samples from seven Michigan regions in this exact map image. These are not station measurements, regional averages, or full-region minima and maxima. Shared colors span multiple legend intervals; those intervals are combined. The underlying gridded numbers are not supplied with the image.
Midwestern Regional Climate Center · PRISM Weather Data. Generated Tue Oct 13, 2026 20:22:06 EDT.
Updated .
Average Temperature - Departure from Mean
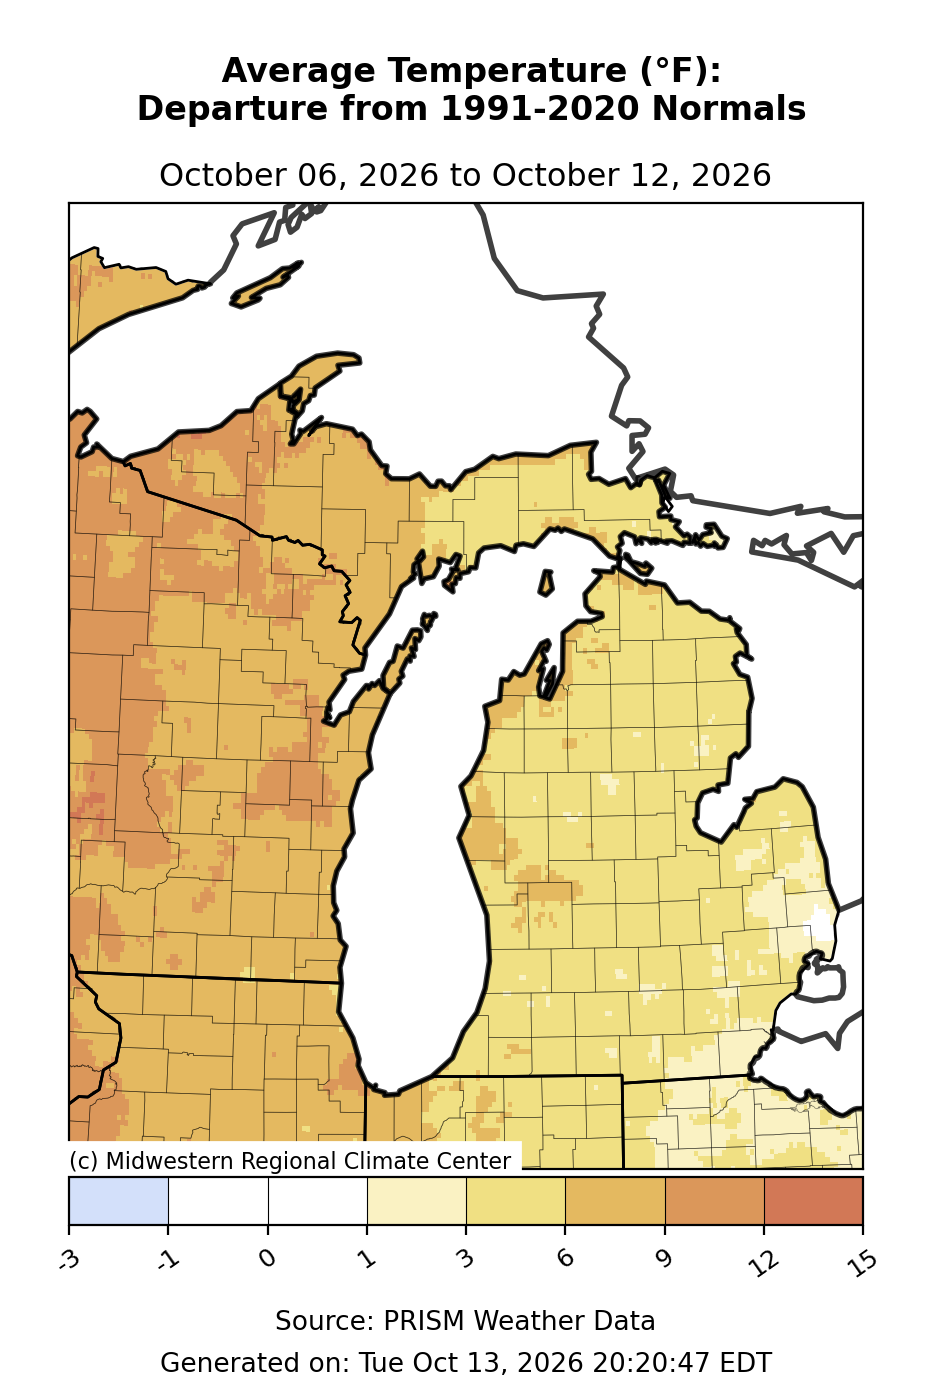
Text description: Average Temperature - Departure from Mean, Past 7 days
October 6, 2026 to October 12, 2026
Western Upper Peninsula: the most frequent sampled color represents 6 to 9 degrees F. Central Upper Peninsula: the most frequent sampled color represents 3 to 6 degrees F. Eastern Upper Peninsula: the most frequent sampled color represents 3 to 6 degrees F. Northern Lower Peninsula: the most frequent sampled color represents 3 to 6 degrees F. Central Lower Peninsula: the most frequent sampled color represents 3 to 6 degrees F. Thumb: the most frequent sampled color represents 1 to 3 degrees F. Southern Lower Peninsula: the most frequent sampled color represents 3 to 6 degrees F.
Legend boundaries (degrees F): -3, -1, 0, 1, 3, 6, 9, 12, 15.
Approximate color-band samples from seven Michigan regions in this exact map image. These are not station measurements, regional averages, or full-region minima and maxima. Shared colors span multiple legend intervals; those intervals are combined. The underlying gridded numbers are not supplied with the image.
Midwestern Regional Climate Center · PRISM Weather Data. Generated Tue Oct 13, 2026 20:20:47 EDT.
Updated .
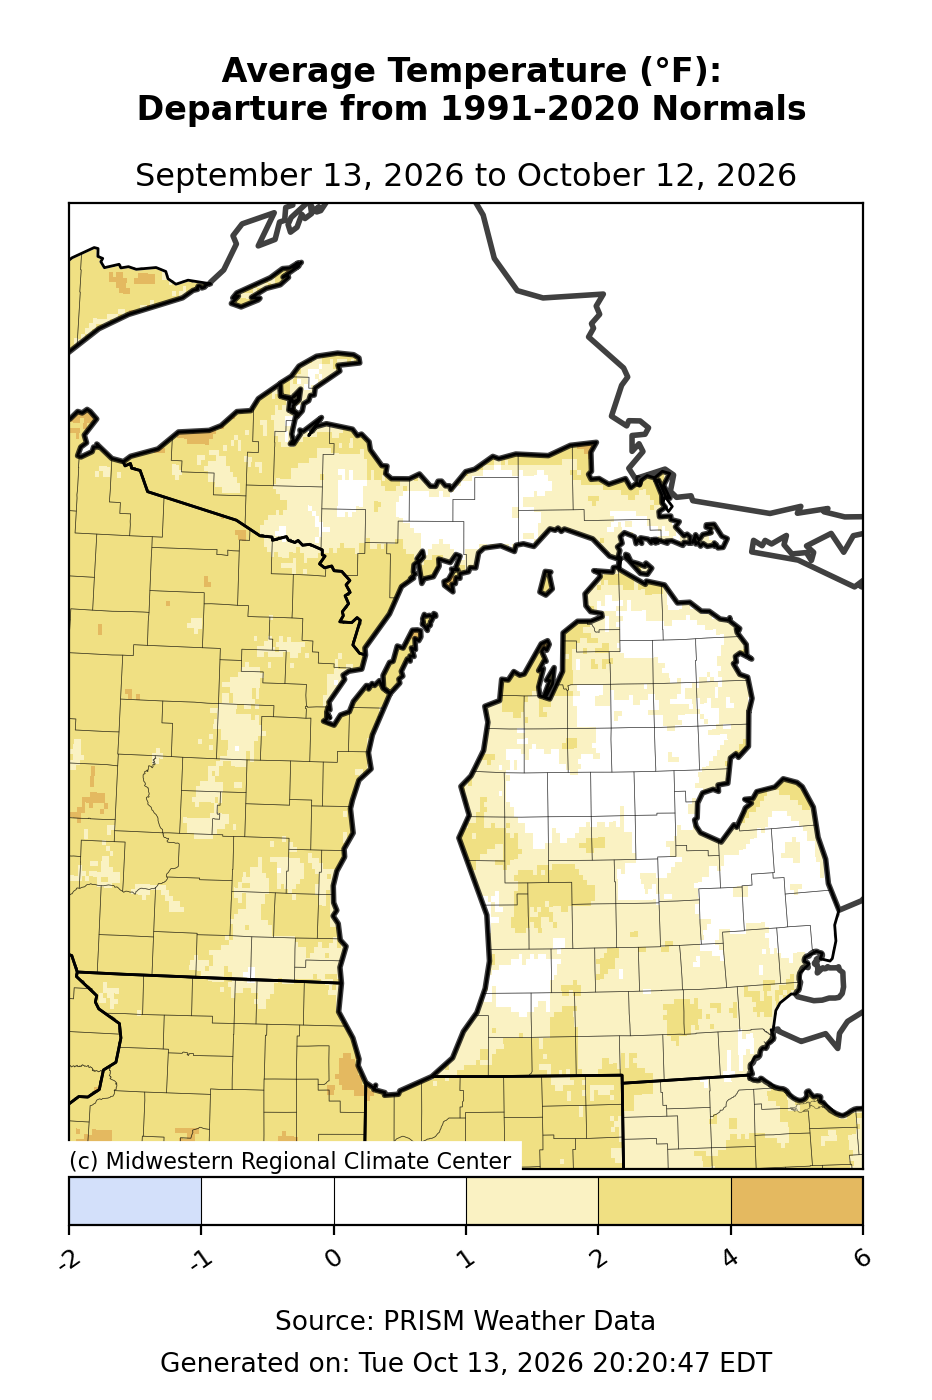
Text description: Average Temperature - Departure from Mean, Past 30 days
September 13, 2026 to October 12, 2026
Western Upper Peninsula: the most frequent sampled color represents 1 to 2 degrees F. Central Upper Peninsula: the most frequent sampled color represents -1 to 1 degrees F. Eastern Upper Peninsula: the most frequent sampled color represents 1 to 2 degrees F. Northern Lower Peninsula: the most frequent sampled color represents 1 to 2 degrees F. Central Lower Peninsula: the most frequent sampled color represents -1 to 1 degrees F. Thumb: the most frequent sampled color represents -1 to 1 degrees F. Southern Lower Peninsula: the most frequent sampled color represents 1 to 2 degrees F.
Legend boundaries (degrees F): -2, -1, 0, 1, 2, 4, 6.
Approximate color-band samples from seven Michigan regions in this exact map image. These are not station measurements, regional averages, or full-region minima and maxima. Shared colors span multiple legend intervals; those intervals are combined. The underlying gridded numbers are not supplied with the image.
Midwestern Regional Climate Center · PRISM Weather Data. Generated Tue Oct 13, 2026 20:20:47 EDT.
Updated .
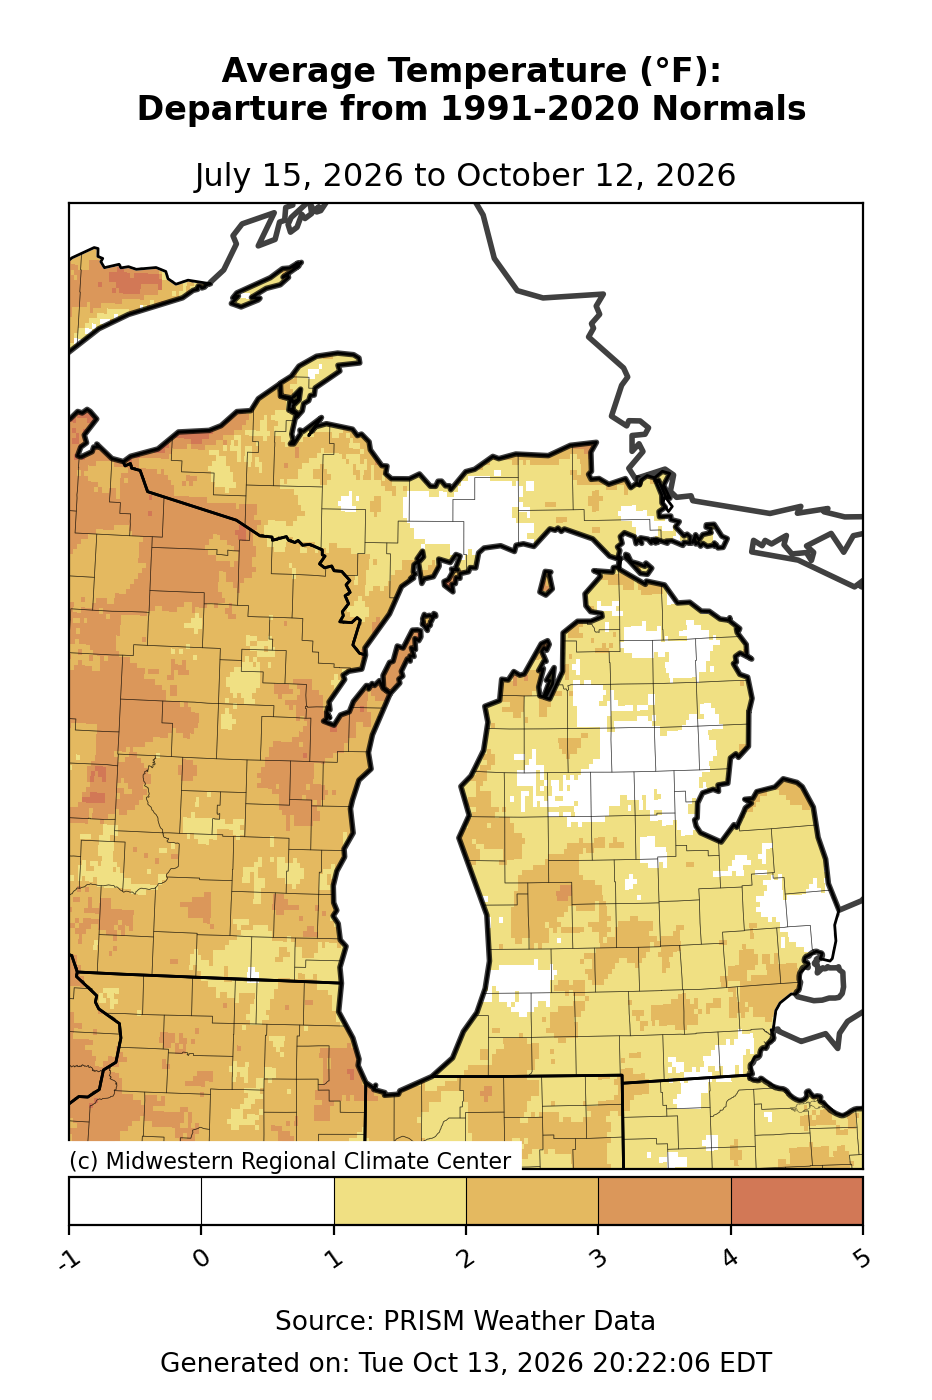
Text description: Average Temperature - Departure from Mean, Past 90 days
July 15, 2026 to October 12, 2026
Western Upper Peninsula: the most frequent sampled color represents 2 to 3 degrees F. Central Upper Peninsula: the most frequent sampled color represents -1 to 1 degrees F. Eastern Upper Peninsula: the most frequent sampled color represents 1 to 2 degrees F. Northern Lower Peninsula: the most frequent sampled color represents 1 to 2 degrees F. Central Lower Peninsula: the most frequent sampled color represents -1 to 1 degrees F. Thumb: the most frequent sampled color represents 1 to 2 degrees F. Southern Lower Peninsula: the most frequent sampled color represents 1 to 2 degrees F.
Legend boundaries (degrees F): -1, 0, 1, 2, 3, 4, 5.
Approximate color-band samples from seven Michigan regions in this exact map image. These are not station measurements, regional averages, or full-region minima and maxima. Shared colors span multiple legend intervals; those intervals are combined. The underlying gridded numbers are not supplied with the image.
Midwestern Regional Climate Center · PRISM Weather Data. Generated Tue Oct 13, 2026 20:22:06 EDT.
Updated .
Average Low Temperature
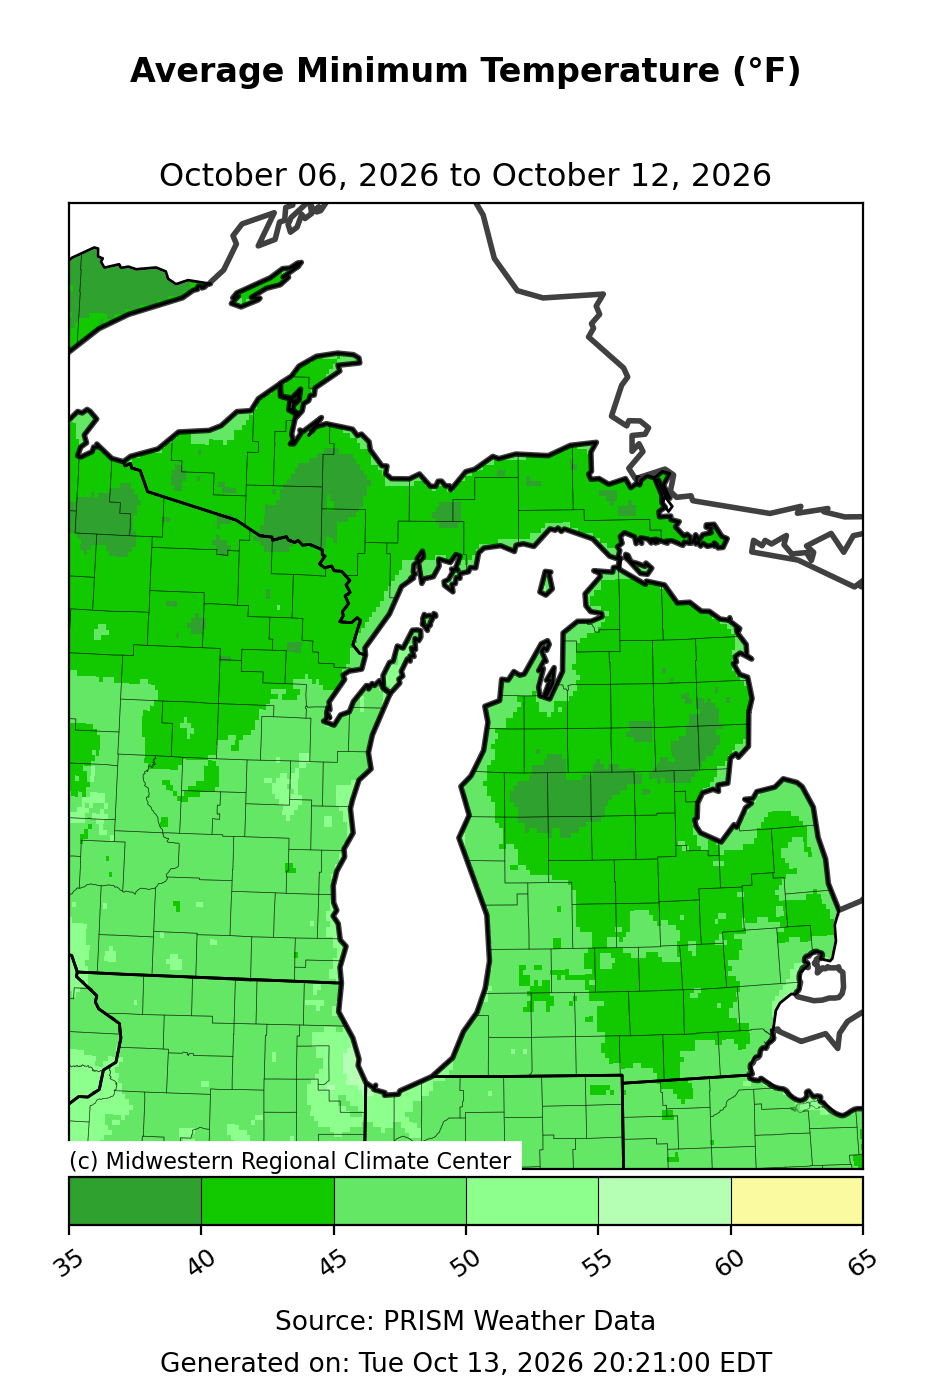
Text description: Average Low Temperature, Past 7 days
October 6, 2026 to October 12, 2026
Western Upper Peninsula: the most frequent sampled color represents 35 to 40 degrees F. Central Upper Peninsula: the most frequent sampled color represents 40 to 45 degrees F. Eastern Upper Peninsula: the most frequent sampled color represents 40 to 45 degrees F. Northern Lower Peninsula: the most frequent sampled color represents 40 to 45 degrees F. Central Lower Peninsula: the most frequent sampled color represents 40 to 45 degrees F. Thumb: the most frequent sampled color represents 40 to 45 degrees F. Southern Lower Peninsula: the most frequent sampled color represents 40 to 45 degrees F.
Legend boundaries (degrees F): 35, 40, 45, 50, 55, 60, 65.
Approximate color-band samples from seven Michigan regions in this exact map image. These are not station measurements, regional averages, or full-region minima and maxima. Shared colors span multiple legend intervals; those intervals are combined. The underlying gridded numbers are not supplied with the image.
Midwestern Regional Climate Center · PRISM Weather Data. Generated Tue Oct 13, 2026 20:21:00 EDT.
Updated .
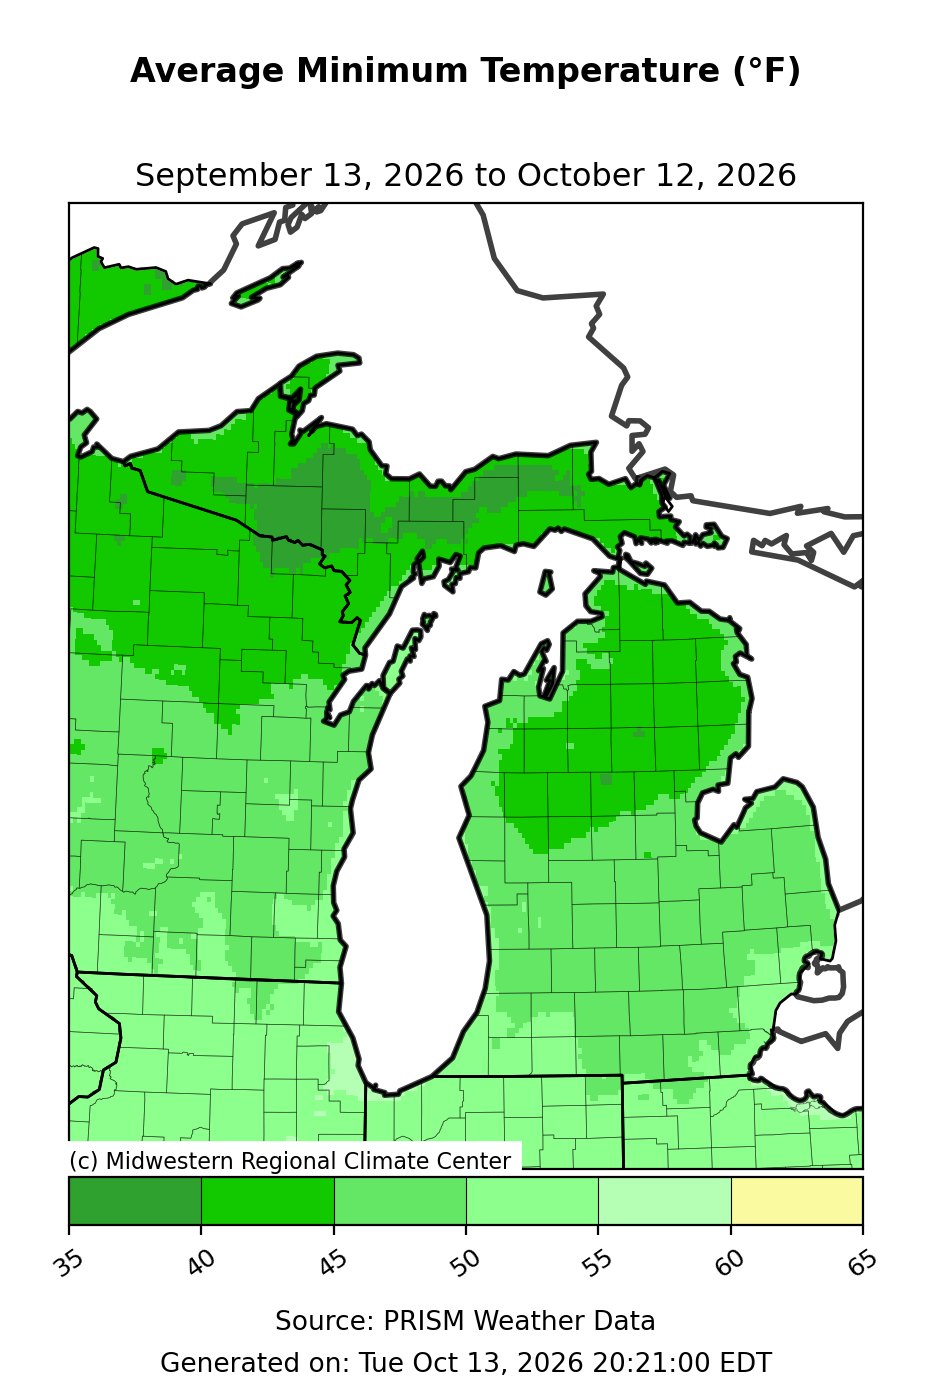
Text description: Average Low Temperature, Past 30 days
September 13, 2026 to October 12, 2026
Western Upper Peninsula: the most frequent sampled color represents 35 to 40 degrees F. Central Upper Peninsula: the most frequent sampled color represents 35 to 40 degrees F. Eastern Upper Peninsula: the most frequent sampled color represents 40 to 45 degrees F. Northern Lower Peninsula: the most frequent sampled color represents 40 to 45 degrees F. Central Lower Peninsula: the most frequent sampled color represents 40 to 45 degrees F. Thumb: the most frequent sampled color represents 45 to 50 degrees F. Southern Lower Peninsula: the most frequent sampled color represents 45 to 50 degrees F.
Legend boundaries (degrees F): 35, 40, 45, 50, 55, 60, 65.
Approximate color-band samples from seven Michigan regions in this exact map image. These are not station measurements, regional averages, or full-region minima and maxima. Shared colors span multiple legend intervals; those intervals are combined. The underlying gridded numbers are not supplied with the image.
Midwestern Regional Climate Center · PRISM Weather Data. Generated Tue Oct 13, 2026 20:21:00 EDT.
Updated .
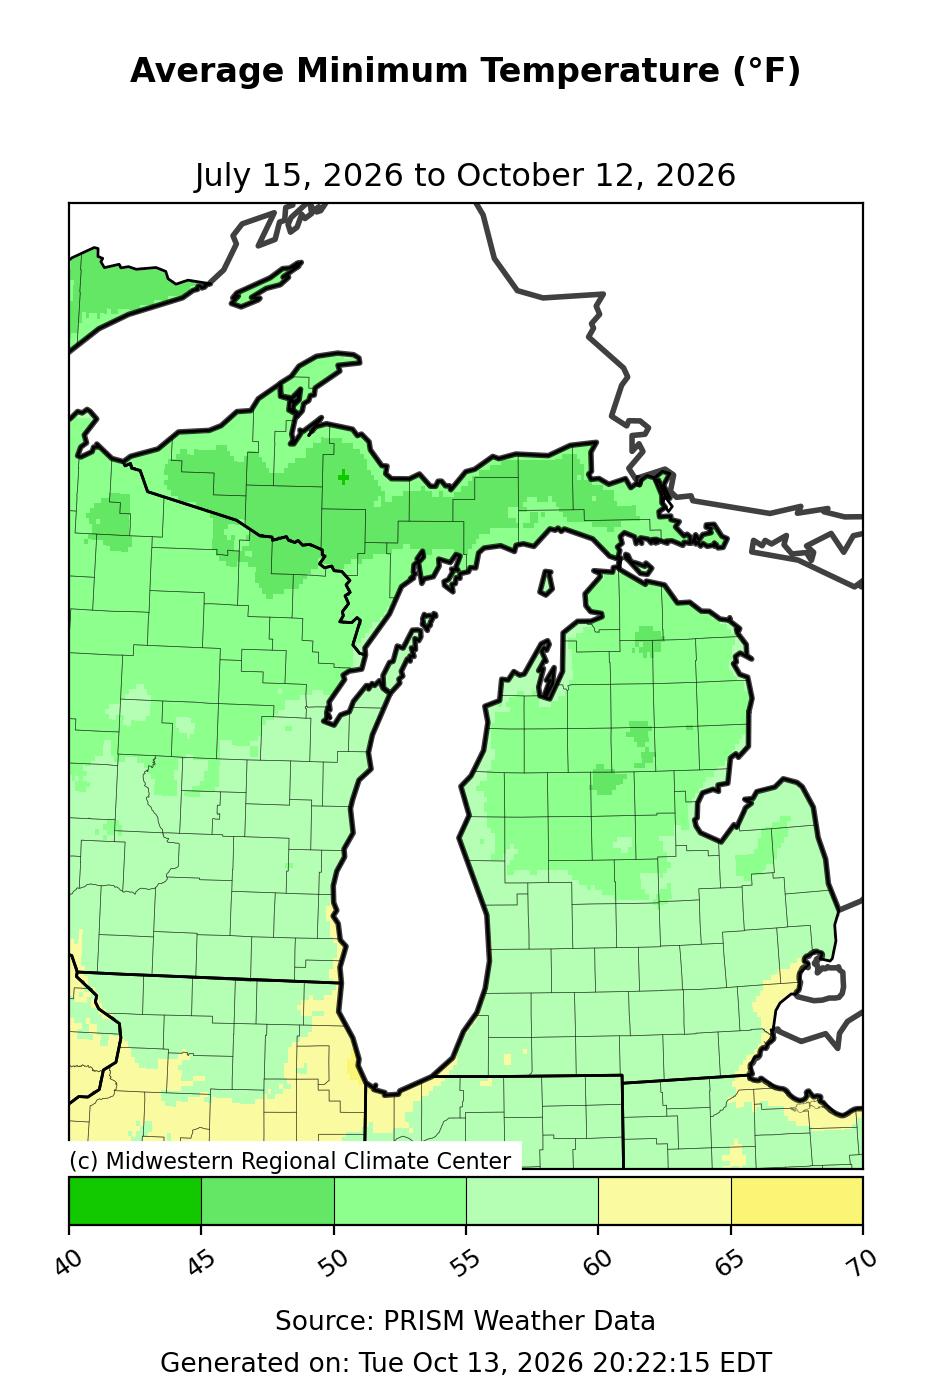
Text description: Average Low Temperature, Past 90 days
July 15, 2026 to October 12, 2026
Western Upper Peninsula: the most frequent sampled color represents 45 to 50 degrees F. Central Upper Peninsula: the most frequent sampled color represents 45 to 50 degrees F. Eastern Upper Peninsula: the most frequent sampled color represents 45 to 50 degrees F. Northern Lower Peninsula: the most frequent sampled color represents 50 to 55 degrees F. Central Lower Peninsula: the most frequent sampled color represents 50 to 55 degrees F. Thumb: the most frequent sampled color represents 55 to 60 degrees F. Southern Lower Peninsula: the most frequent sampled color represents 55 to 60 degrees F.
Legend boundaries (degrees F): 40, 45, 50, 55, 60, 65, 70.
Approximate color-band samples from seven Michigan regions in this exact map image. These are not station measurements, regional averages, or full-region minima and maxima. Shared colors span multiple legend intervals; those intervals are combined. The underlying gridded numbers are not supplied with the image.
Midwestern Regional Climate Center · PRISM Weather Data. Generated Tue Oct 13, 2026 20:22:15 EDT.
Updated .
Average Low Temperature - Departure from Mean
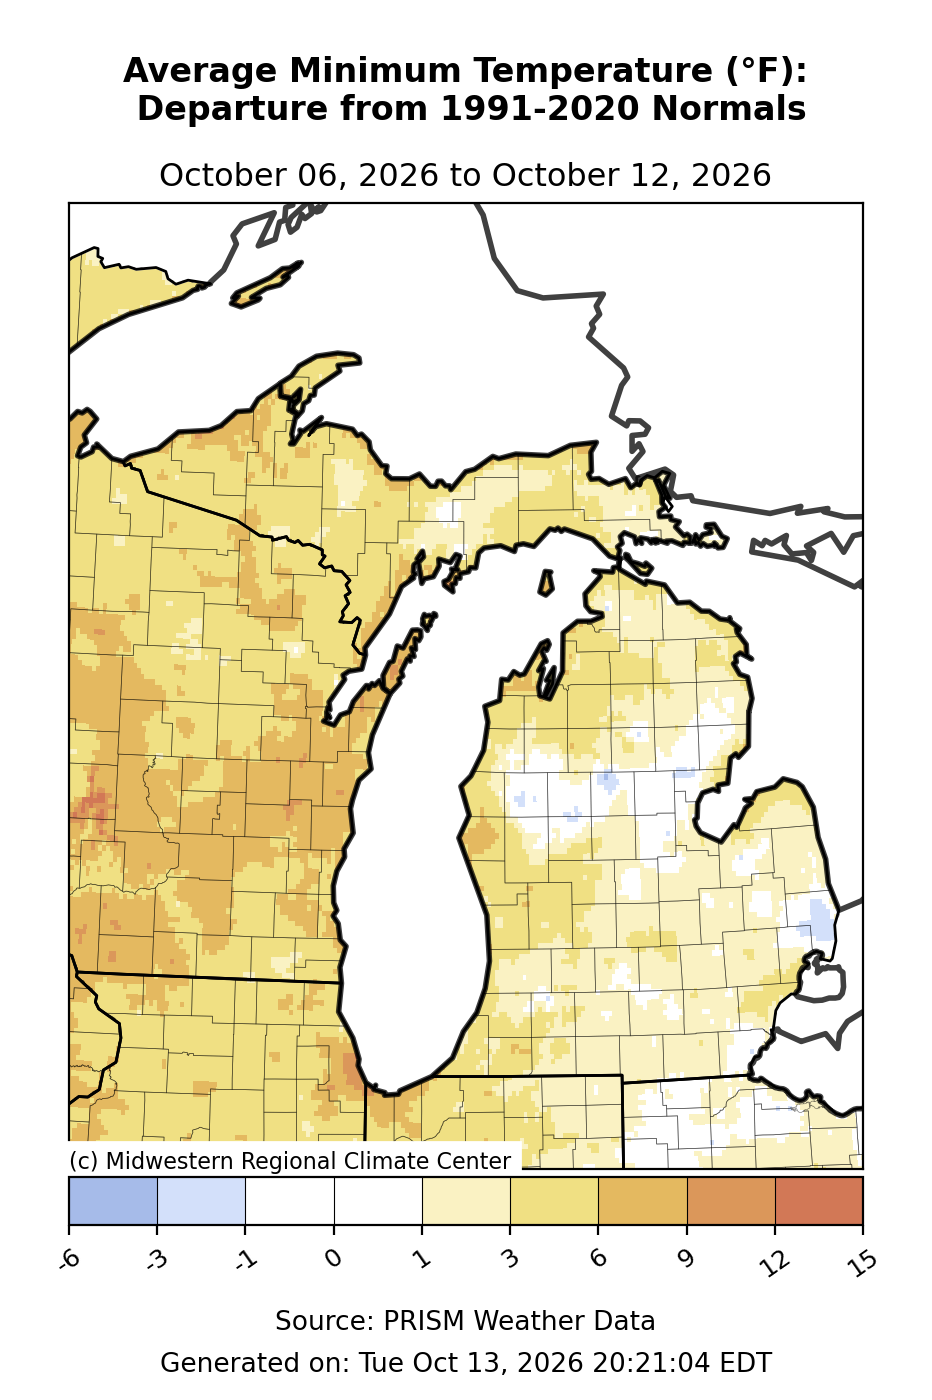
Text description: Average Low Temperature - Departure from Mean, Past 7 days
October 6, 2026 to October 12, 2026
Western Upper Peninsula: the most frequent sampled color represents 3 to 6 degrees F. Central Upper Peninsula: the most frequent sampled color represents 1 to 3 degrees F. Eastern Upper Peninsula: the most frequent sampled color represents 1 to 3 degrees F. Northern Lower Peninsula: the most frequent sampled color represents 3 to 6 degrees F. Central Lower Peninsula: the most frequent sampled color represents -1 to 1 degrees F. Thumb: the most frequent sampled color represents 1 to 3 degrees F. Southern Lower Peninsula: the most frequent sampled color represents 1 to 3 degrees F.
Legend boundaries (degrees F): -6, -3, -1, 0, 1, 3, 6, 9, 12, 15.
Approximate color-band samples from seven Michigan regions in this exact map image. These are not station measurements, regional averages, or full-region minima and maxima. Shared colors span multiple legend intervals; those intervals are combined. The underlying gridded numbers are not supplied with the image.
Midwestern Regional Climate Center · PRISM Weather Data. Generated Tue Oct 13, 2026 20:21:04 EDT.
Updated .
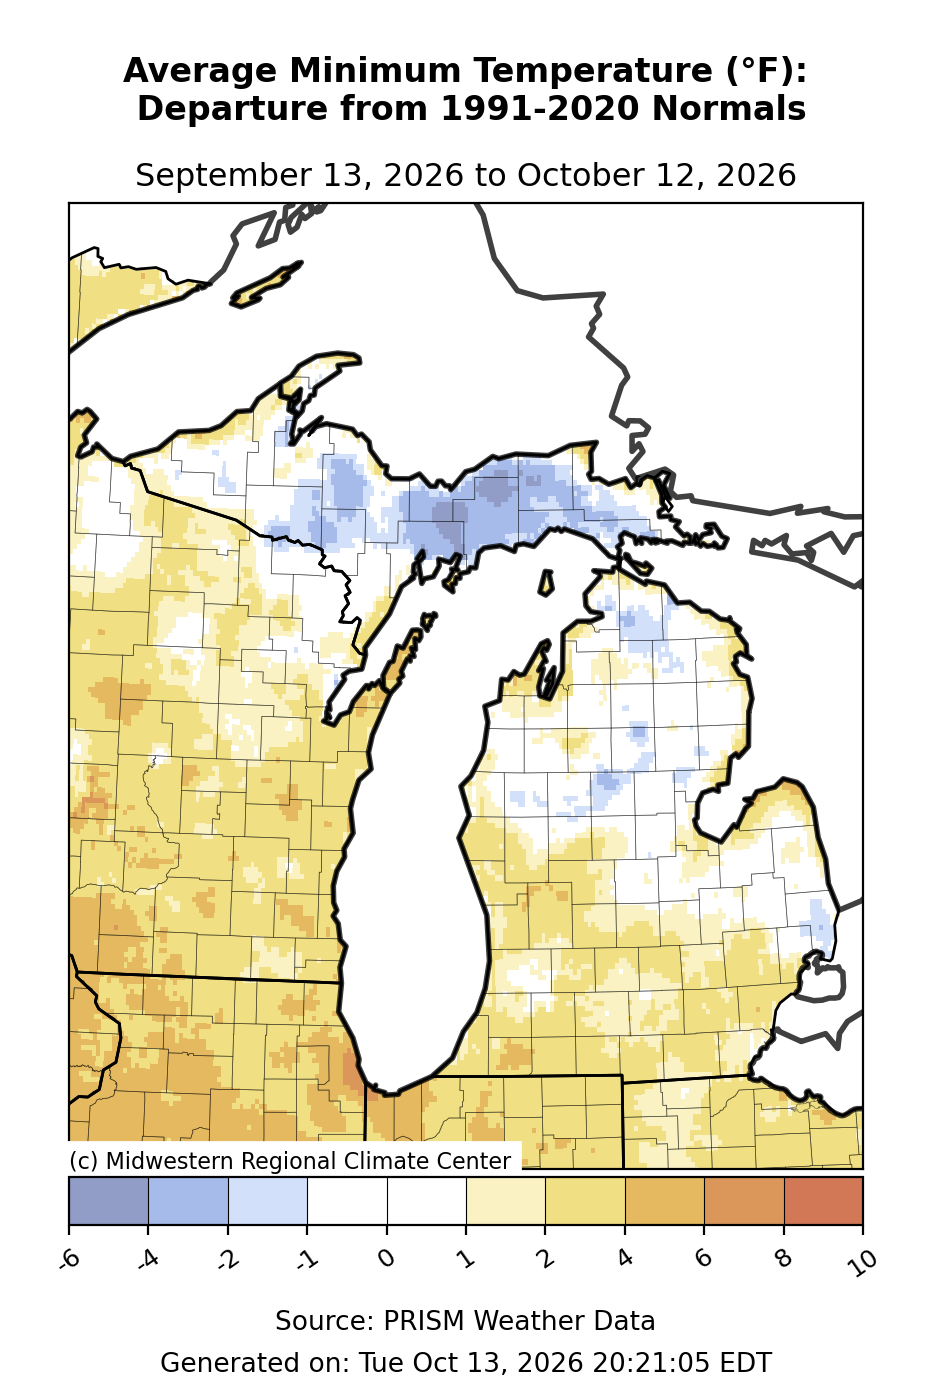
Text description: Average Low Temperature - Departure from Mean, Past 30 days
September 13, 2026 to October 12, 2026
Western Upper Peninsula: the most frequent sampled color represents -1 to 1 degrees F. Central Upper Peninsula: the most frequent sampled color represents -4 to -2 degrees F. Eastern Upper Peninsula: the most frequent sampled color represents -4 to -2 degrees F. Northern Lower Peninsula: the most frequent sampled color represents -1 to 1 degrees F. Central Lower Peninsula: the most frequent sampled color represents -1 to 1 degrees F. Thumb: the most frequent sampled color represents -1 to 1 degrees F. Southern Lower Peninsula: the most frequent sampled color represents 2 to 4 degrees F.
Legend boundaries (degrees F): -6, -4, -2, -1, 0, 1, 2, 4, 6, 8, 10.
Approximate color-band samples from seven Michigan regions in this exact map image. These are not station measurements, regional averages, or full-region minima and maxima. Shared colors span multiple legend intervals; those intervals are combined. The underlying gridded numbers are not supplied with the image.
Midwestern Regional Climate Center · PRISM Weather Data. Generated Tue Oct 13, 2026 20:21:05 EDT.
Updated .
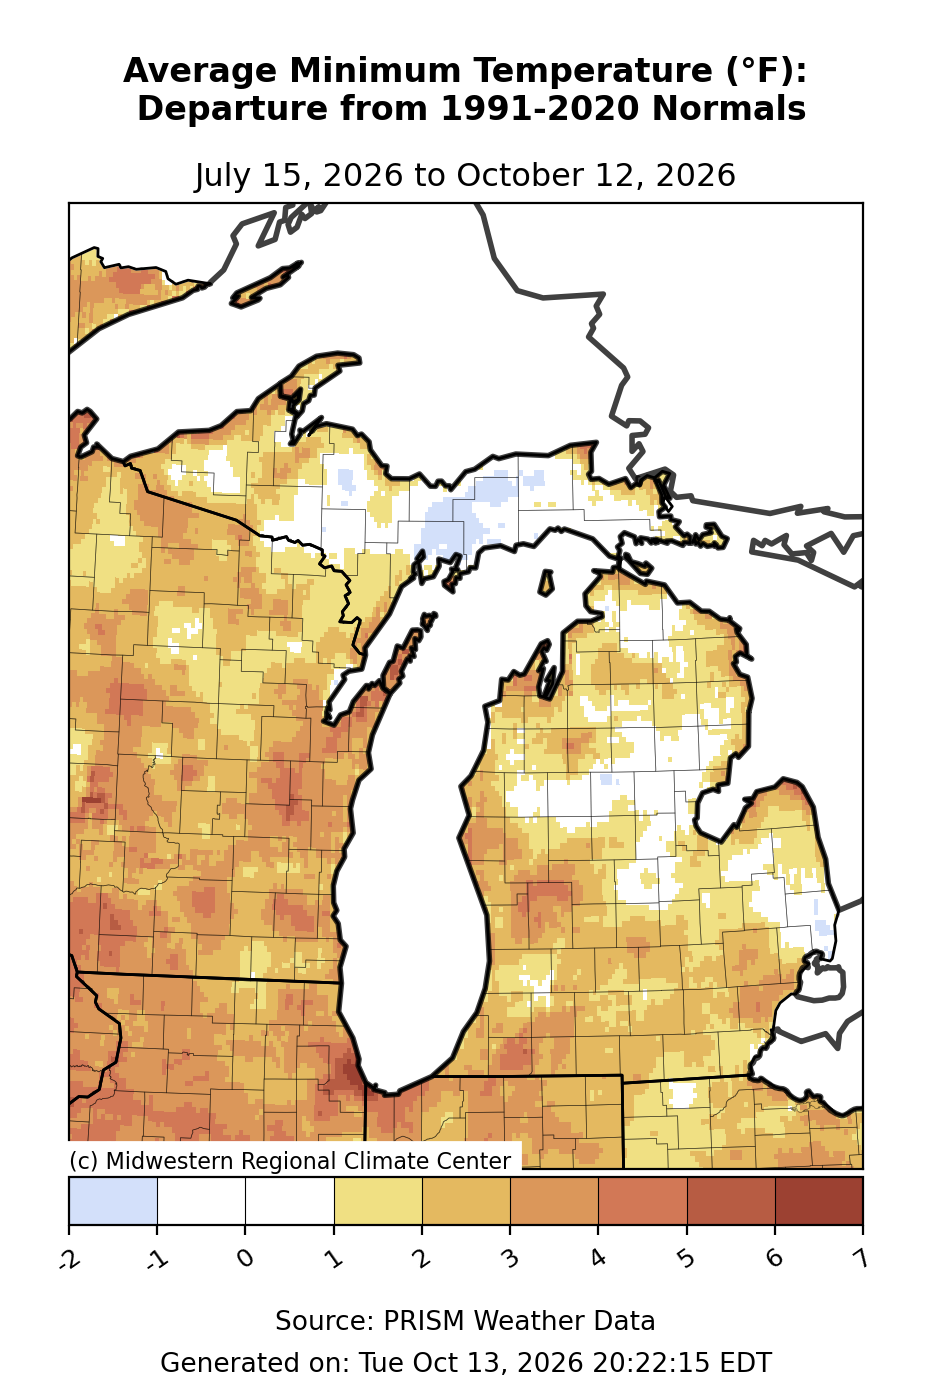
Text description: Average Low Temperature - Departure from Mean, Past 90 days
July 15, 2026 to October 12, 2026
Western Upper Peninsula: the most frequent sampled color represents 1 to 2 degrees F. Central Upper Peninsula: the most frequent sampled color represents -2 to -1 degrees F. Eastern Upper Peninsula: the most frequent sampled color represents -1 to 1 degrees F. Northern Lower Peninsula: the most frequent sampled color represents 1 to 2 degrees F. Central Lower Peninsula: the most frequent sampled color represents -1 to 1 degrees F. Thumb: the most frequent sampled color represents 1 to 2 degrees F. Southern Lower Peninsula: the most frequent sampled color represents 2 to 3 degrees F.
Legend boundaries (degrees F): -2, -1, 0, 1, 2, 3, 4, 5, 6, 7.
Approximate color-band samples from seven Michigan regions in this exact map image. These are not station measurements, regional averages, or full-region minima and maxima. Shared colors span multiple legend intervals; those intervals are combined. The underlying gridded numbers are not supplied with the image.
Midwestern Regional Climate Center · PRISM Weather Data. Generated Tue Oct 13, 2026 20:22:15 EDT.
Updated .